Data basis: 15 markets (DAX, FTSE, CAC, SMI, Dow, Nasdaq, S&P 500, Nikkei, Hang Seng, ASX 200, gold, EURUSD, GBPUSD, USDJPY, bitcoin), Dukascopy minute data. Search period 5 January 2015 to 30 December 2022, physically separate holdout 1 January 2023 to 5 June 2026, exactly one holdout run per candidate. Costs per market as spread plus slippage, raised outside cash hours. Every calculation chain also ran on random markets with identical code. Global Benjamini-Hochberg correction (q = 0.10) over all holdout tests. No trading recommendation.
The question was simple: what do you find if you forget everything you think you know and search the data from scratch? No own setups, no favourite ideas, no weighting by gut feeling. Instead, every pattern family that books, forums and papers call profitable, on the same data and under the same rules.
The rules were strict, because a pattern search always finds something otherwise. Test 900,000 variants at a 5% error rate and you get about 45,000 "significant" hits without any of them being real. So every variant was logged, every calculation chain was checked against a random market, and only a small number of candidates named in advance were allowed into the holdout at all.
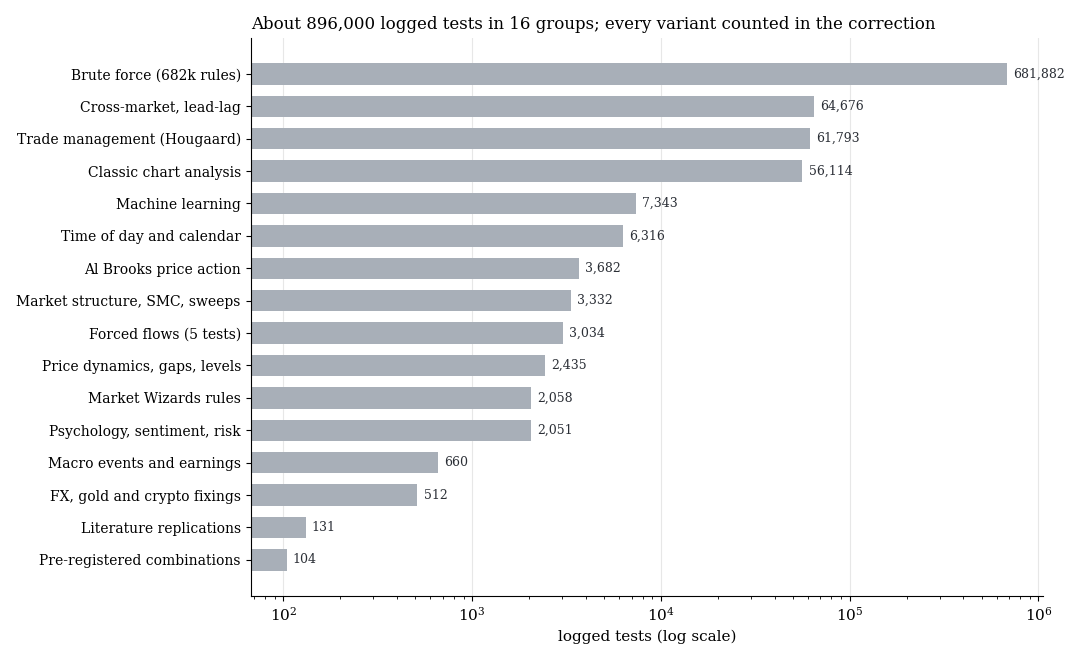
Number of logged tests in the 16 groups, log scale. Every variant counts in the multiple-testing correction, including those that looked bad.
1. The protocol
| Component | Implementation |
|---|---|
| Search period | 2015 to 2022, the only place where searching and optimising was allowed |
| Holdout | 2023 to June 2026, stored physically apart, exactly one run per candidate |
| Random market | every minute candle mirrored around its open with probability ½: same volatility, same daily profile, no direction |
| Ledger | every tested variant with sample, mean and t-value |
| Benchmarks | random walk, placebo days, placebo levels, entry one or two minutes later, costs times 1.5 |
| Verification | every candidate reproduced by an independent re-implementation before it could enter the holdout |
| Correction | Benjamini-Hochberg over all holdout tests together |
The random market was the most important tool. It has the same volatility, the same quiet and hectic hours, the same jumps, but no direction. Any rule that makes money there measures the calculation chain, not the market. How effective this protection is shows in the study on the random market as a ruler: our own older backtest chain earned up to 0.5 R per trade there.
2. The families and their results
| Family | What was tested | Result | Study |
|---|---|---|---|
| Candlestick patterns | engulfing, pin bar, doji, inside bar, NR7 and relatives | random level | Candlestick patterns |
| Chart formations | head and shoulders, double tops, triangles, flags | target rate as in a random walk (46.5 vs 46.8%) | Formations, measured moves |
| VWAP and indicators | VWAP bands, RSI, MACD, Bollinger, confluences | outside bitcoin no variant net t ≥ 3 | VWAP and indicators |
| Al Brooks | always-in, H2/L2, wedges, failed breakouts | "80% of breakouts fail" = random rate of 80.3% | Al Brooks |
| Hougaard | 3,780 management policies | management alone on the random market = minus costs | Hougaard |
| Market Wizards | Raschke, Williams, Crabel, Sperandeo, Fisher, Schwartz | 54 hits at p < 0.05 where about 51 are expected | Market Wizards |
| Market structure | retests, sweeps, FVG, order blocks, OTE, Silver Bullet | real levels get retested no more often than invented ones; 0 of 3,308 rules pass | Smart money concepts |
| Price dynamics | gaps, shocks, opening range, levels, round numbers | random walk; round numbers break more often than placebo levels | Gaps and levels |
| Turning points | overnight range and prior close | clustering = dwell-time artefact | Overnight range |
| Time and calendar | drift map, weekday, turn of month, expiry | no index window positive net | Time and calendar |
| First vs last hour | "the close follows the open" | agreement 48 to 51% | First and last hour |
| Macro events | FOMC, NFP, CPI, ECB, earnings | intraday chance level | Macro events |
| Markets among each other | lead-lag, handovers, relative value | real, but at most 0.58 times the costs | Lead-lag |
| Psychology and risks | fear spikes, sentiment, geopolitics, moon | random markets produce more strong results | Psychology |
| Single idea | Nasdaq falls at 8 am, short the retest | negative in every variant | Nasdaq retest |
| Literature | seven published anomalies rebuilt, pre-registered | gross 40 to 80% of the paper size, net zero | Literature |
| Machine learning | 98 features, ridge and XGBoost, walk-forward | out-of-sample IC +0.004 to +0.006 | Machine learning |
| Brute force | 682,000 rules, 20 random-market searches | best finding worse than the typical random finding | Brute force |
| Fixings | London, gold, bitcoin, yuan, ECB | no edge | Fixings |
| Further forced flows | volatility-target funds, Japanese fiscal year-end | no edge | Forced flows |
| Index rebalancing | closing auction on event days | FTSE confirmed globally | Index event days |
| Tokyo fix | Japanese companies buying dollars at 09:55 | passed locally, not globally, forward test | Tokyo fix |
3. The holdout
Out of all families, 19 candidates made it into the holdout. In the search period all of them looked plausible, with t-values between 2.2 and 4.9. That is exactly what you expect when you pick the best out of hundreds of thousands of variants. The holdout shows how much of that was selection.
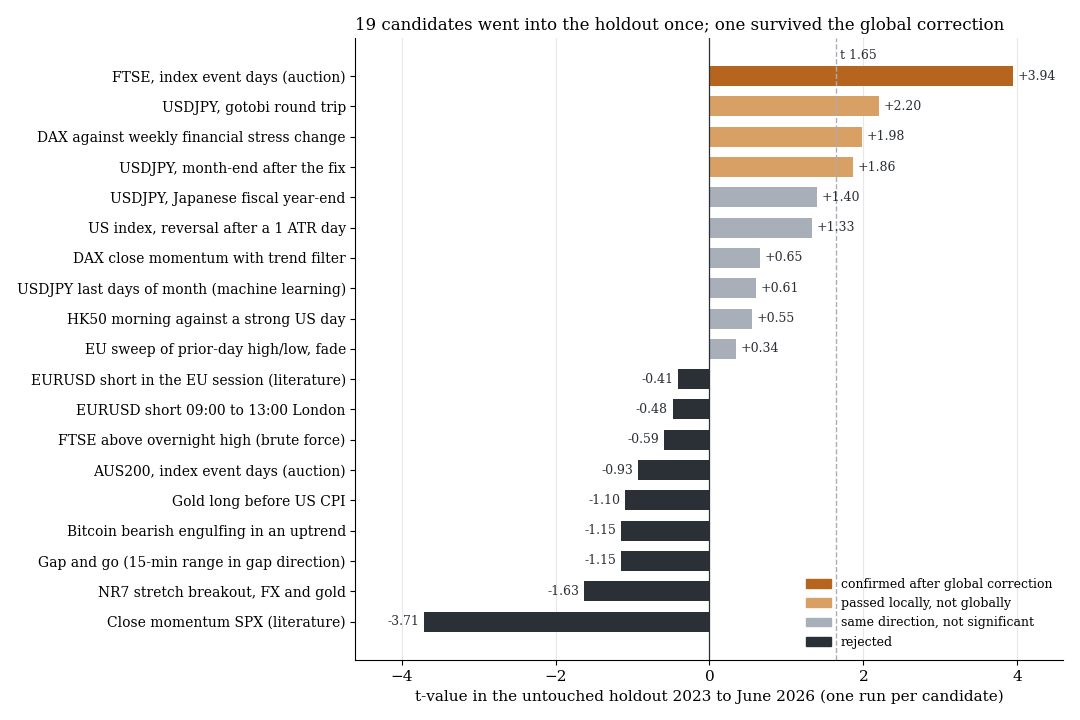
t-value per candidate in the untouched holdout from 2023 to June 2026, one run each. Orange: confirmed after the global correction. Light: passed locally, not globally. Grey: same direction but not significant. Dark: rejected.
| Outcome | Count | Examples |
|---|---|---|
| confirmed globally (q = 0.0008) | 1 | FTSE on index event days, +11.5 bps per event day, t 3.9 |
| passed locally, not globally (q 0.13 to 0.15) | 3 | two Tokyo fix rules, one financial stress rule suspected of revision lookahead |
| same direction, not significant | 6 | US reversal after a large prior day (65% from a single day) |
| rejected | 9 | including a close-momentum rule from the literature that ran significantly reversed in the holdout (t −3.7) |
The most interesting case is the pair of index event markets. Sydney was stronger in the search period (t 3.4) and died in the holdout. London was weaker (t 2.3) and survived. That is a reason to treat even the one finding with care.
4. What remained
Two things have a counterparty that must trade at a fixed moment, and both point the same way in every control:
- Index event days in the FTSE: passive funds trade index changes in the closing auction. Holdout +11.5 bps per event day, +11.9 bps on real broker ticks, about eight dates a year. To the study.
- The Tokyo fix in USDJPY: Japanese companies buy dollars at 09:55. +4.5 to +5.6 bps per trade on real ticks, not confirmed globally, pre-registered forward test until September 2027. To the study.
Then there are structures that are real but not tradable: from a move of 0.3 to 0.5 ATR onwards, trends continue in 52 to 54% of cases instead of 50%. Markets measurably lead each other. Round numbers get broken more often than invented levels. All of it is smaller than the spread of a CFD.
5. What it means
Directional patterns on CFD minute data are empty after costs. That holds for the classic chart patterns as much as for the methods of well-known traders and for machine learning. What remains has a mechanism: someone who must trade at a fixed moment, whatever the price. These edges are small and rare, but they do not disappear because someone else knows them too.
The second lesson concerns the tool. The biggest source of error was not the market but the calculation chain. Without checking a backtest against a random market, you cannot tell whether you are measuring the market or your simulation.
6. Limits
- Mechanical rules on CFD minute data with fixed costs. Discretion, order book data, futures costs and multi-day holding periods were outside the scope.
- Power of the holdout. 3.4 years are not enough to confirm or rule out real effects of 1 to 2 basis points. "Not found" means "not demonstrable as a rule with a positive expectation".
- Patterns that only emerged from 2023 (for example with the boom in zero-day options) cannot be found by this design. That was the deliberate price of a clean holdout.
- BID data create false effects around the rollover (17:00 New York) and the gold reopening. These windows were blocked or computed with real spreads.
- Revised macro data create lookahead unless real-time vintages are used. The one affected candidate is marked accordingly.
Disclaimer: Historical statistics are no guarantee of future market behaviour. This study is not investment advice. Trading carries a risk of loss up to total loss.