Data basis: DAX, FTSE, CAC, Dow, NQ, SPX, gold, EUR/USD, GBP/USD, USD/JPY and Bitcoin; Dukascopy CFD minute data (bid), aggregated into 5-minute, 15-minute and 1-hour candles. Search period 2015–2022 (Bitcoin from May 2017), no holdout run for VWAP, indicators and combinations. The VWAP is a daily VWAP weighted by the tick activity of the data feed (not exchange volume), the bands are standard deviations (SD). Indicators with standard parameters. Costs per round trip (spread plus slippage): DAX 2.5 points, FTSE 1.5, CAC 1.5, Dow 4, NQ 2.5, SPX 0.8, EUR/USD 1.3 pips, GBP/USD 2.0, USD/JPY 1.6, gold 0.40 USD, Bitcoin 10 bps. Benchmarks: placebo (the ordinary candle of the same colour at the same time of day), drift (“always long” at the same time of day) and a random market run with identical code. No trading recommendation.
The VWAP is seen as the fair price of the day that large participants steer by. Textbooks derive two rules from it: when price moves two standard deviations away, it returns to the VWAP, and whoever stands above the VWAP buys. For indicators the standard rules run roughly: buy RSI(2) below 10, buy at the lower Bollinger Band, follow an EMA crossover, an MACD crossover or a Donchian breakout. Anyone combining several signals (“confluence”) hopes for fewer false signals.
We measured all three claims: 3,088 VWAP tests, 5,760 indicator tests and ten combinations with 3,132 tests. The combinations were pre-registered, that is, fixed before the first test and not changed afterwards. Every test also runs with the same code on a random market (minute candles mirrored at their open with probability ½).
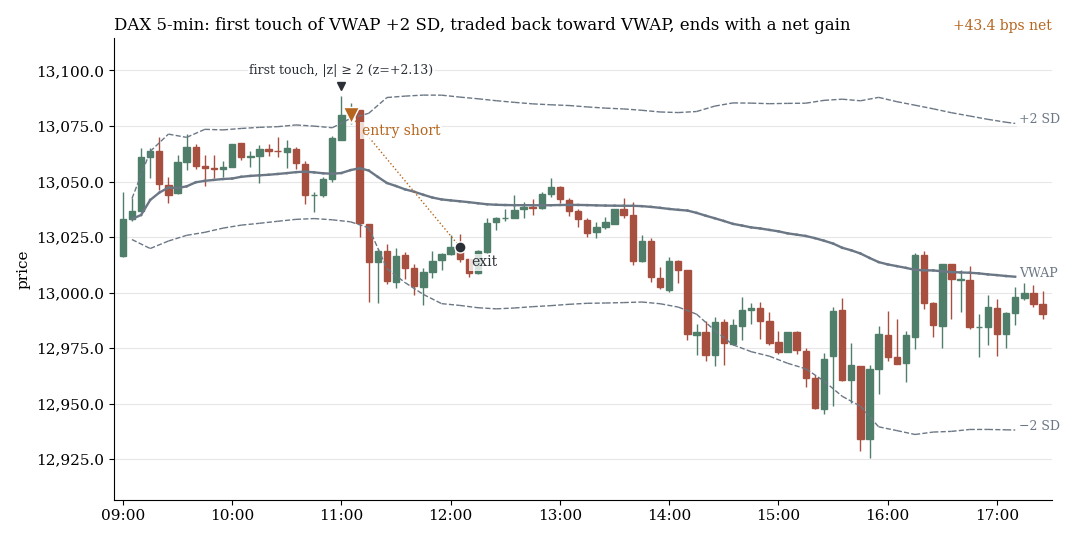
DAX, 5-minute candles, 3 Dec 2019: first touch of VWAP +2 SD, short toward the VWAP, exit after 60 minutes, net +43.4 bps. The four examples come from the search period 2015–2022 and were drawn at random with a fixed seed from all detected cases, not picked.
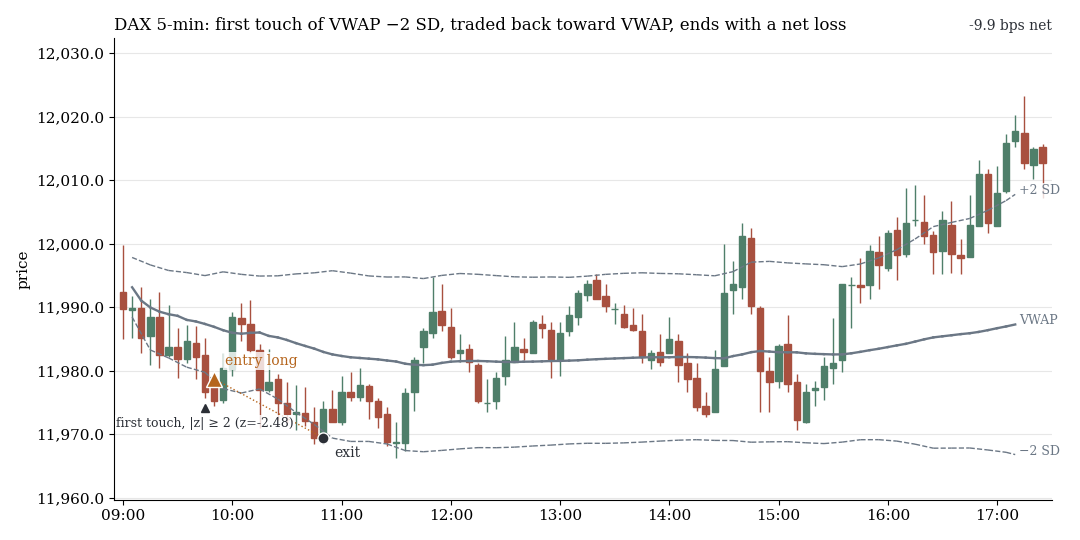
Second random example, 5 Apr 2019: first touch of VWAP −2 SD, long toward the VWAP, net −9.9 bps.
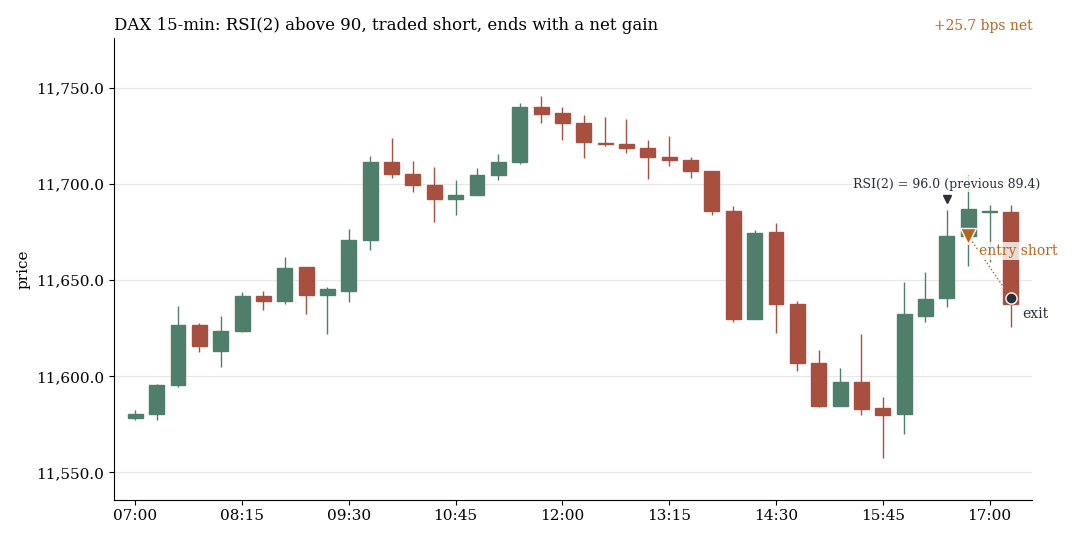
DAX, 15-minute candles, 7 Aug 2019: RSI(2) crosses above 90, short, exit after 45 minutes, net +25.7 bps.
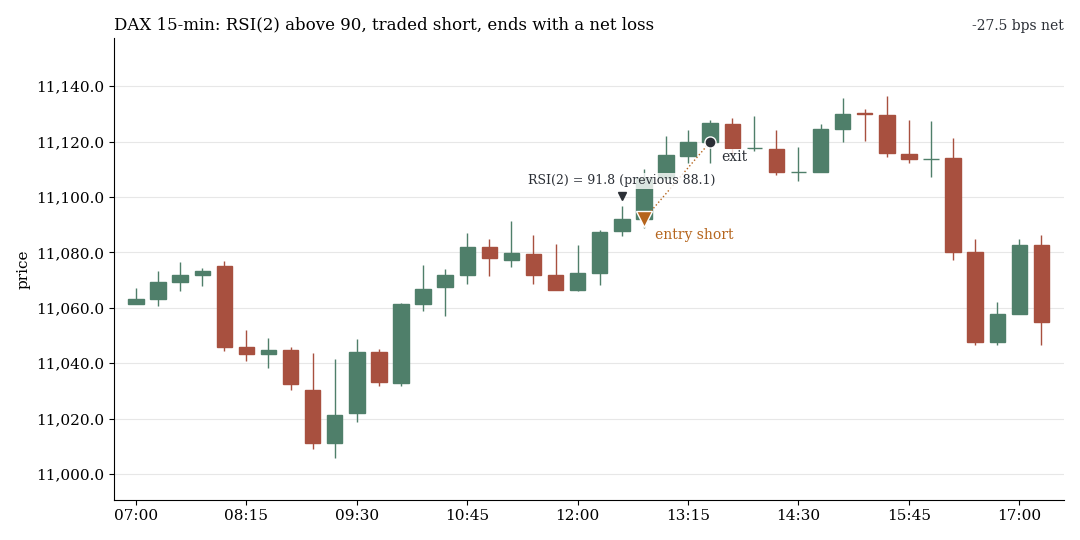
DAX, 23 Jan 2019: same rule, net −27.5 bps.
1. VWAP: neither return nor trend beyond the costs
We checked the VWAP in three ways: as a position (price above or below the VWAP at fixed times), as a band (first touch of ±1 to ±3 SD) and as an event (cross, bounce, reclaim after at least six candles on one side).
| Test type | Tests | Highest net t |
|---|---|---|
| Position at fixed times | 1,476 | 2.81 |
| Position, only at 1 or 2 SD distance or more | 492 | 1.91 |
| First touch of the bands | 560 | 2.56 |
| Bounce | 224 | 1.95 |
| Cross | 224 | 1.75 |
| Reclaim | 112 | 1.99 |
No test reaches net t 3. All 9 tests with t ≥ 2 sit on Bitcoin, the random market has one. For band touches the question is whether price returns or runs on. The table shows the gross return in the return direction: positive means a return to the VWAP, negative means trend.
| Gross return in bps | EU indices | US indices | FX | Gold | Bitcoin |
|---|---|---|---|---|---|
| ±2 SD touched, exit after 60 minutes | −0.81 | +0.16 | −0.01 | +0.37 | −5.68 |
| ±2 SD touched, exit at the end of the day | −1.70 | +3.06 | −0.29 | −1.20 | −32.97 |
| Cost per round trip (bps, at the 2015–2022 median price) | 2.02 to 2.83 | 1.58 to 3.43 | 1.15 to 1.52 | 3.02 | 10 |
In the EU indices and in Bitcoin price tends to run on. In the US indices it returns by 1.25 to 4.17 bps gross by the end of the day, depending on the band, but no US test reaches net t 2. As a filter for the rest of the day, the position relative to the VWAP shows a weak trend direction: 60 minutes before the close gross t +2.5 in the US indices, against +0.7 with the day's open as the line. Net, that does not carry either.
2. Indicators: tiny gross, net the costs
The 5,760 indicator tests cover 36 signal sides: RSI(2) and RSI(14), Bollinger touch, re-entry and squeeze, EMA crossovers, MACD, stochastic, Donchian-20 and ADX filters. The table shows five of them in the textbook direction (15-minute candles, 45-minute holding period, gross in bps, t in brackets).
| Signal, textbook direction | EU indices | US indices | FX | Gold | Bitcoin |
|---|---|---|---|---|---|
| RSI(2) below 10, trend filter EMA 200 | +0.27 (+0.6) | +0.16 (+0.3) | +0.22 (+2.4) | +0.84 (+3.5) | +3.36 (+2.7) |
| Close below the lower Bollinger Band | +0.40 (+0.8) | +0.77 (+1.0) | +0.22 (+2.2) | +0.11 (+0.4) | −1.20 (−0.8) |
| EMA 9 crosses above EMA 21 | −0.25 (−0.6) | −0.30 (−0.4) | −0.20 (−2.0) | +0.11 (+0.4) | +0.70 (+0.5) |
| MACD crosses above the signal line | +0.76 (+2.2) | 0.00 (0.0) | −0.11 (−1.5) | +0.10 (+0.5) | +1.25 (+1.1) |
| Close above the Donchian-20 high | −0.14 (−0.4) | +0.12 (+0.3) | −0.19 (−2.3) | +0.26 (+1.1) | +2.81 (+2.1) |
The values are mostly below 1 bp. RSI(2) with a trend filter works most clearly in gold (+0.84 bps, t 3.5) and in FX: the right way round, but 0.2 to 0.8 bps against costs of 1.15 to 3.02 bps.
Net, 40 of the 5,760 tests reach t ≥ 2 (random market: 5) and 9 reach t ≥ 3 (random market: 0), the highest value is 3.70. Bitcoin supplies 36 of the 40 and all 9. Outside Bitcoin four tests reach t ≥ 2 (DAX 3, NQ 1, highest value 2.68 with only 90 trades) and none reaches t ≥ 3. In Bitcoin the best tests run against the textbook: a stochastic cross down, then long, on 1-hour candles to the end of the day earns +49.1 bps on 1,026 trades (t 3.70), RSI(14) above 70, then long, +54.0 bps on 525 trades (t 3.29). That is Bitcoin momentum, not an indicator effect.
3. Combinations: no better than their parts
Of the ten pre-registered combinations we show three, each long and mirrored short. The table gives the DAX (15-minute candles, 45-minute holding period, in each case the better direction) and the best row across all markets.
| Combination | DAX: trades | DAX: net bps (t) | Best row: trades | Best row: net bps (t) |
|---|---|---|---|---|
| RSI(2) below 10 and close below the lower Bollinger Band | 3,917 | −1.68 (−3.39) | 6,201, Bitcoin to end of day | +6.62 (1.14) |
| Hammer at the day's low and RSI(14) below 30 | 614 | +0.28 (0.24) | 740, Bitcoin to end of day | +57.66 (2.90) |
| Inside-bar breakout and close on the matching side of the VWAP | 4,747 | −1.64 (−4.25) | 8,257, Bitcoin to end of day | +6.21 (1.08) |
Across the ten combinations, of 3,132 tests 10 reach net t ≥ 2 (random market: 2) and two reach t ≥ 3, both in Bitcoin. Outside Bitcoin the highest value is t 2.25 with 71 trades. No combination is better than its parts.
4. All three families together
The best results are Bitcoin every time: VWAP 2.81, indicators 3.70, combinations 3.35. The random markets deliver at most 2.09, 2.43 and 2.41. Across all 56,114 tests of the chart family, a single finding would need about t 4.8 after the multiple-test correction.
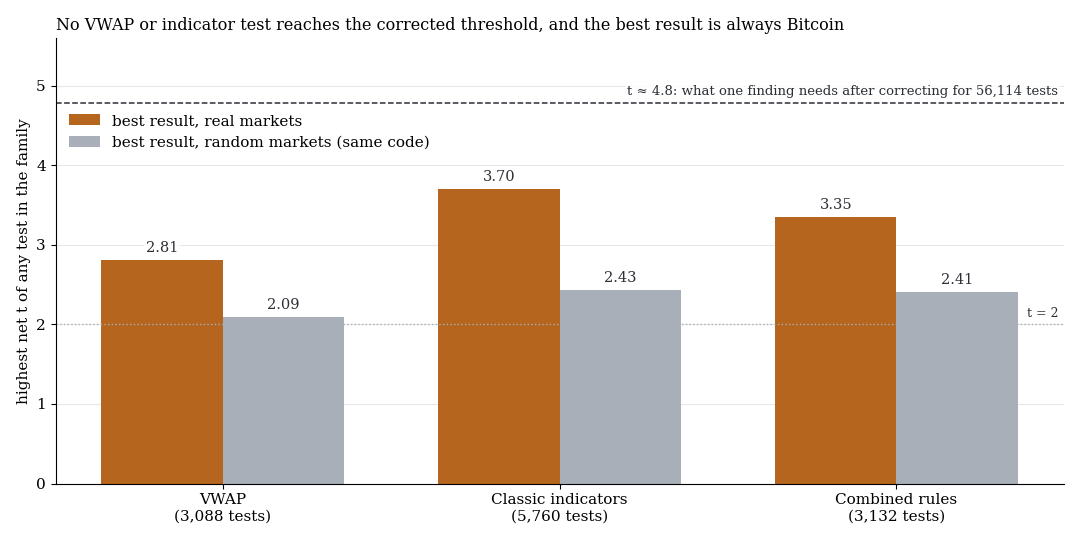
Highest net t per family, orange real markets, grey random markets with identical code. Dashed: about t 4.8, what a single finding would need after correcting for 56,114 tests.
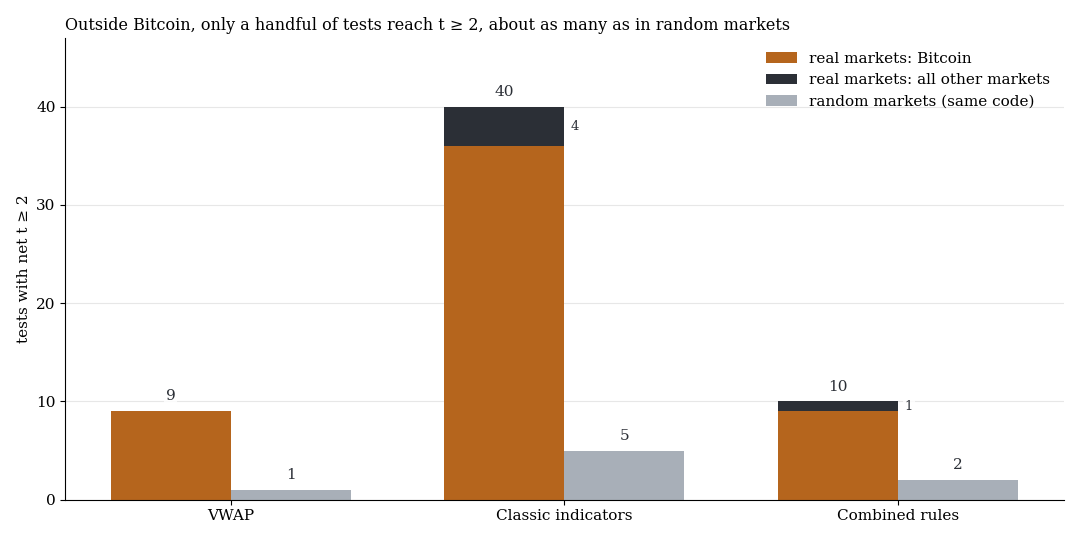
Tests with net t ≥ 2: real markets, split into Bitcoin and all other markets, against the random markets (all markets together).
What it means
An indicator recomputes price history. It can only predict what is already in it. On indices, gold and FX that structure is smaller than the costs or absent. In FX there is a real but tiny micro-reversal of 0.2 to 0.8 bps, and it belongs to the spread.
What remains is Bitcoin momentum 2017–2022. For the related candlestick pattern it failed the holdout, see the candlestick study. According to these numbers VWAP, RSI, Bollinger and MACD are not signals, and combinations do not make one out of them.
Limits
- VWAP from tick activity. Dukascopy provides no exchange volume. As a control, a time-weighted average is used (median distance to the tick VWAP about 0.2 SD). In 2015 EU days without ticks are missing.
- Standard parameters. RSI 2 and 14, Bollinger 20/2, EMA 9/21, 20/50 and 200, MACD 12/26/9, Donchian 20. Neighbouring values only for the top results, other settings were not tested.
- Time exits and fixed brackets only. No trailing stop, no adding to positions, no discretionary management.
- Continuous candle series. The indicators run on the 24-hour CFD series as in a CFD chart, pure cash-session charts were not tested.
- Small samples. The tests outside Bitcoin with t ≥ 2 rest on 71 to 162 trades.
- No holdout. All numbers come from 2015–2022. For VWAP, indicators and combinations there was no candidate and therefore no holdout run.
- CFD bid, fixed cost model. Real fills are more likely worse.
- Not tested: HK50, JPN225, AUS200, SMI, daily and weekly charts.
All pattern families of the scan in the overview. Related are the mistakes in AI-built strategies, the random-walk yardstick and Fibonacci zones as a forecast. The sister studies cover candlestick patterns and chart formations.
Disclaimer: Historical statistics are no guarantee of future market behaviour. This study is not investment advice. Trading carries a risk of loss up to total loss.