Data basis: DAX, FTSE, CAC, Dow, NQ, SPX, gold, EUR/USD, GBP/USD, USD/JPY and Bitcoin; Dukascopy CFD minute data (bid), aggregated into 5-minute, 15-minute and 1-hour candles. Search period 2015–2022 (Bitcoin from May 2017), holdout 2023 to 5 June 2026 for exactly one candidate. Costs per round trip (spread plus slippage): DAX 2.5 points, FTSE 1.5, CAC 1.5, Dow 4, NQ 2.5, SPX 0.8, EUR/USD 1.3 pips, GBP/USD 2.0, USD/JPY 1.6, gold 0.40 USD, Bitcoin 10 bps. Benchmarks: the ordinary candle of the same colour at the same time of day in the same context (placebo), “always long” at the same time of day (drift) and a random market run with identical code. No trading recommendation.
Candlestick patterns are at the core of chart analysis. An engulfing candle is meant to announce a turn, a pin bar the rejection of a price level, an inside-bar breakout the start of a move. In hindsight you can find a matching pattern for almost any move. That explains their popularity, but not whether they knew anything beforehand.
We measured it: twelve patterns, each long and short (engulfing, pin bar, doji, inside-bar breakout, outside bar, 3-bar reversal, NR4, NR7, marubozu, runs of three to five same-coloured candles), plus contexts such as time of day and the trend before, several holding periods and three time frames, 31,663 variants in total. Each one also runs with the same code on a random market. There every minute candle is mirrored at its open with probability ½: the volatility stays, the direction is destroyed. Whatever a pattern achieves there is not a pattern. The test is part of a scan with about 893,000 logged tests.
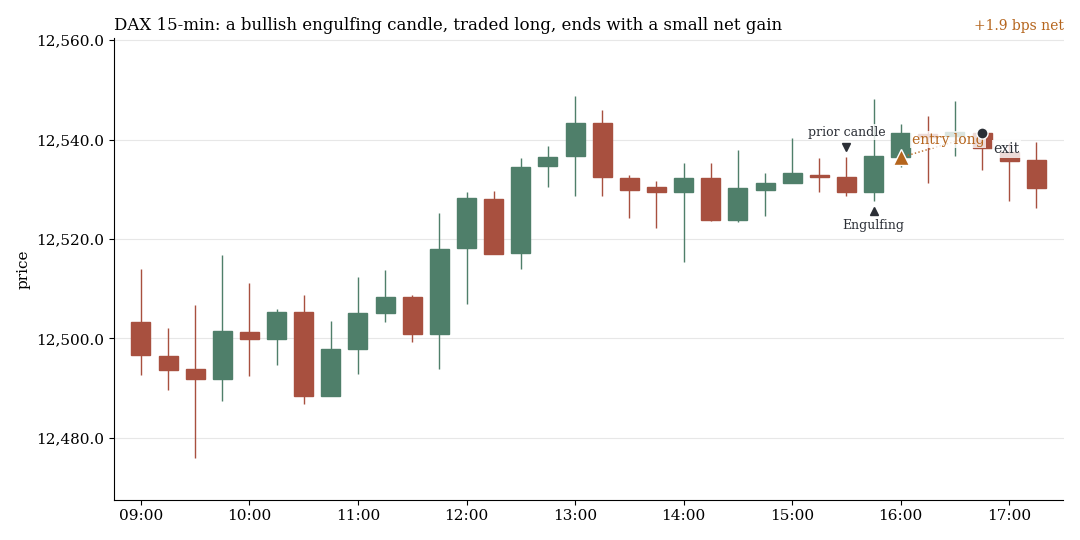
DAX, 15-minute candles, 24 Jul 2019: bullish engulfing, entry long at the next open, exit after three candles, net +1.9 bps. The four examples come from the search period 2015–2022 and were drawn at random with a fixed seed from all detected cases, not picked.
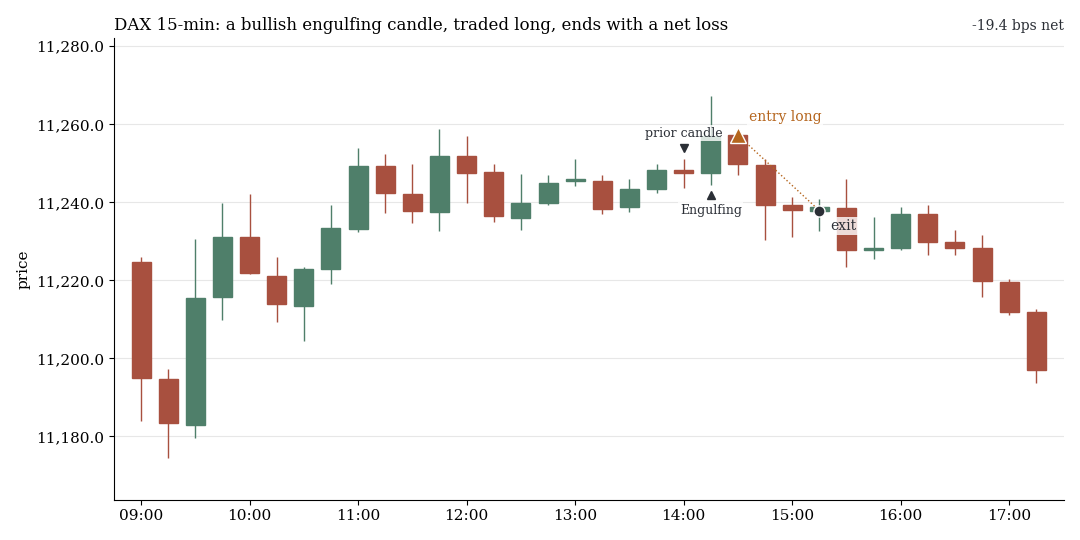
Second random example of the same test, 5 Dec 2018: same rule, net −19.4 bps.
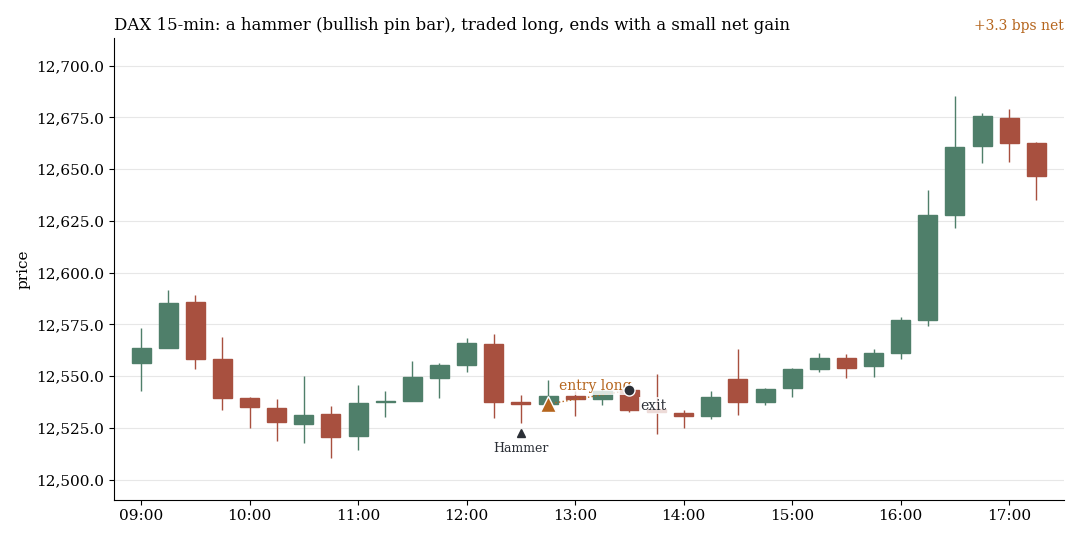
DAX, 15 Oct 2019: hammer (bullish pin bar), entry long, exit after 45 minutes, net +3.3 bps.
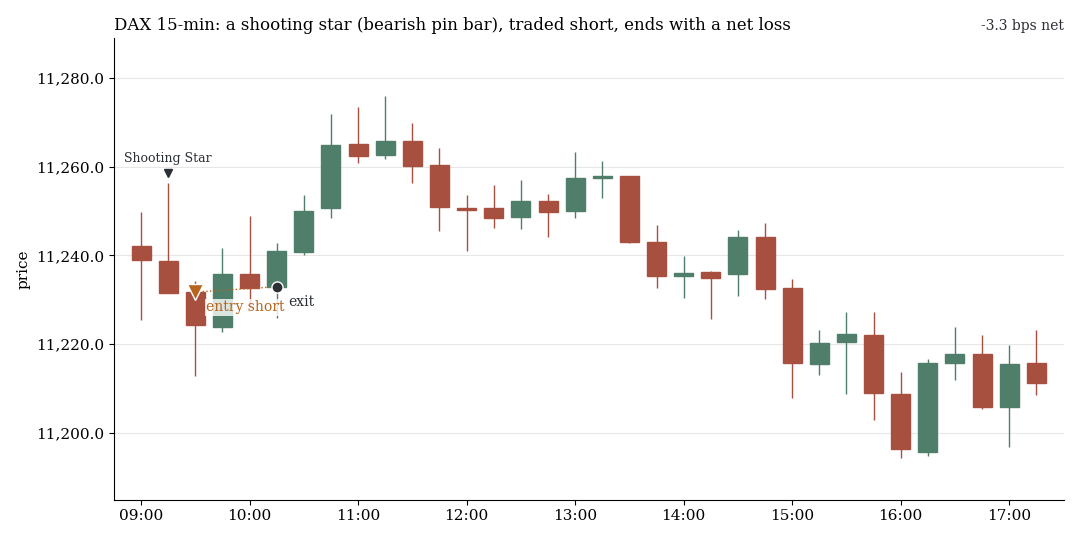
DAX, 28 Jan 2019: shooting star (bearish pin bar), entry short, net −3.3 bps.
1. In the textbook direction, no pattern predicts anything
First the claim itself: after the pattern, does price move in the direction the textbook names? The table shows the gross return for 15-minute candles, all contexts and a 45-minute holding period, in bps with t in brackets. Positive means the pattern works as taught.
| Pattern, textbook direction | EU indices | US indices | FX | Gold | Bitcoin |
|---|---|---|---|---|---|
| Bullish engulfing, long | +0.07 (+0.2) | +0.27 (+0.7) | −0.12 (−2.4) | −0.07 (−0.5) | −0.60 (−0.8) |
| Bearish engulfing, short | 0.00 (0.0) | −0.03 (−0.1) | −0.05 (−0.9) | −0.40 (−2.8) | +0.07 (+0.1) |
| Bullish pin bar, long | −0.14 (−0.4) | +0.11 (+0.3) | −0.16 (−2.7) | +0.11 (+0.7) | +0.14 (+0.2) |
| Bearish pin bar, short | 0.00 (0.0) | −0.91 (−2.1) | −0.17 (−2.7) | −0.03 (−0.2) | −0.80 (−0.8) |
| Cost per round trip (bps, at the 2015–2022 median price) | 2.02 to 2.83 | 1.58 to 3.43 | 1.15 to 1.52 | 3.02 | 10 |
Across all 24 pattern sides the values on the indices lie between −0.95 and +1.08 bps (t from −2.4 to +1.7). None shows the textbook sign at |t| ≥ 2. In FX the sign is negative in all 24 cases, but at 0.03 to 0.33 bps far below the spread. Bitcoin scatters most widely (t from −4.3 to +3.6).
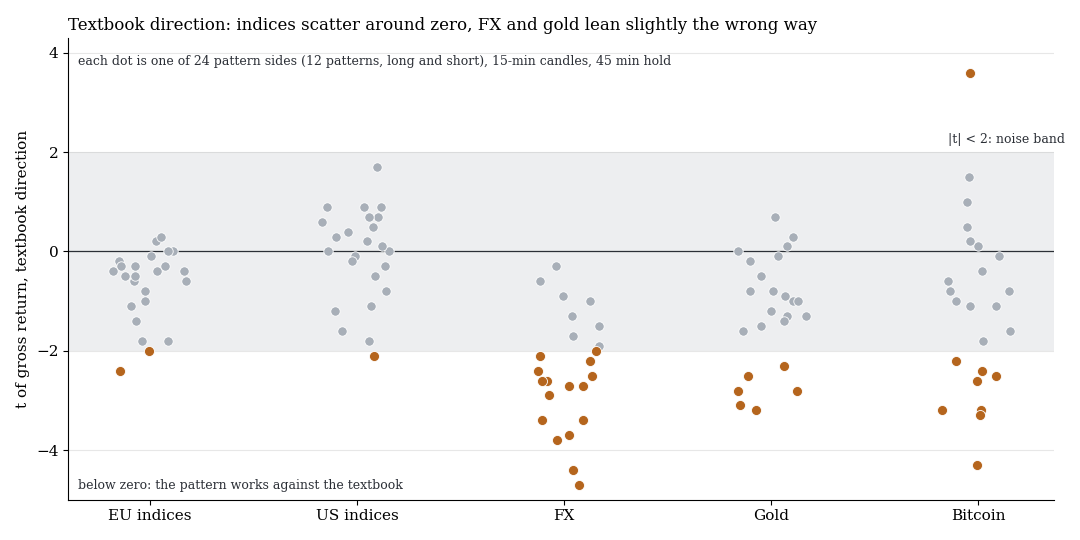
Each dot is one pattern with direction (24 per market group), 15-minute candles, 45-minute holding period. Orange: |t| ≥ 2. Below zero the pattern works against the textbook.
2. Against the random market, Bitcoin is the outlier
Now the comparison with the random market, where no pattern can exist.
| Real markets | Random market | |
|---|---|---|
| Tests | 31,663 | 31,794 |
| Tests with net t ≥ 2 | 191 | 72 |
| Tests with net t ≥ 3 | 27 | 4 |
| Highest net t | 4.60 | 3.90 |
| Tests with gross t ≥ 3 or t ≤ −3 | 924 | 75 |
In total the real markets lead, and the difference comes from Bitcoin: 121 tests with t ≥ 2 against one in the random market, plus 23 of the 27 tests with t ≥ 3. Among the indices it is DAX 9 against 18, FTSE 0 against 16, CAC 8 against 3, Dow 8 against 8, NQ 7 against 0 and SPX 6 against 1. Gross, there is real structure, mainly in FX: there, breakouts run back slightly (t down to −4.7), at 0.2 to 0.6 bps against costs of 1.2 to 2 bps.
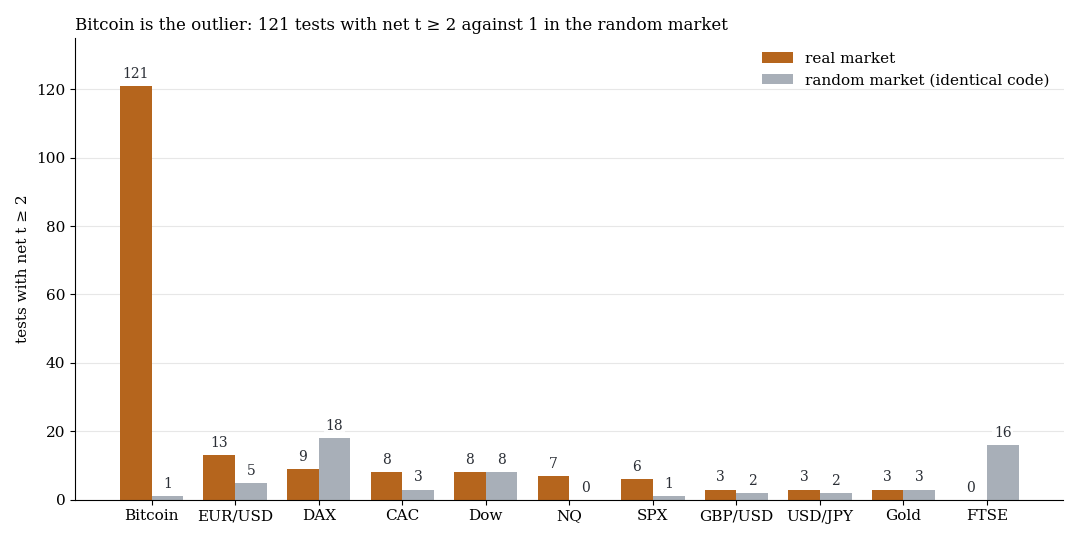
Number of tests with net t ≥ 2 per market (about 2,000 to 2,550 tests each), real markets against the random market with identical code.
The multiple-test correction decides the rest. Of the 56,072 pre-defined tests of the chart family (candlestick patterns, formations, VWAP, indicators, combinations) none passes: the smallest q is 0.142, the requirement is at most 0.10. For a single finding among this many tests, about t 4.8 would be needed.
3. The Bitcoin outlier fails the holdout
The best result runs against the textbook direction. On 1-hour Bitcoin candles, price rises by at least 3 ATR within 12 hours, then a bearish engulfing appears. Classically that is a short signal. We traded it long, at the next open, with an exit after six hours.
In the search period (May 2017 to 2022) it looks like a find: 298 trades, +50.4 bps net, t 4.60, positive in all six years, and +37.2 bps (t 3.39) more than the ordinary red candle in the same context. For the same rule the random market returns −23.0, +5.7 and −37.6 bps in three runs. The weaknesses were visible beforehand: the effect falls from +165 bps (2017) to +10 bps (2022), on 15-minute candles it is negative (t −0.60), and every candle in the same context without a pattern already earns +15.2 bps (t 2.34). We fixed the rule in advance and ran it exactly once on the holdout.
| Search period 2017–2022 | Holdout 2023–2026 | |
|---|---|---|
| Trades | 298 | 141 |
| Mean, net | +50.4 bps | −11.7 bps |
| t | 4.60 | −1.15 |
| Gross | +60.4 bps | −1.7 bps |
| Excess over the ordinary red candle | +37.2 bps (t 3.39) | −11.1 bps (t −1.10) |
| Every candle in the context, no pattern | +15.2 bps (t 2.34) | −2.1 bps (t −0.40) |
| Costs ×1.5 | +45.4 bps (t 4.14) | −16.7 bps (t −1.64) |
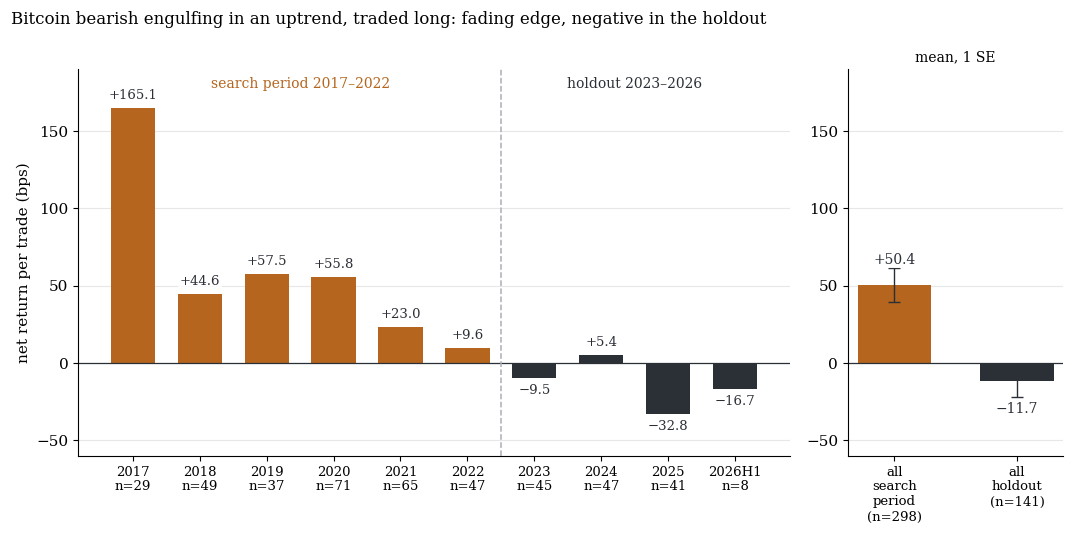
Net return per trade and year, orange in the search period, dark in the holdout (2026 up to 5 June). On the right the totals with one standard error, clustered by trading day.
The holdout mean lies about six standard errors below the search-period value. The context has vanished as well. There is no regime alibi: the gross drift for long positions in the holdout window was about +3.5 bps, so the rule had a tailwind and lost anyway. Without the five best days the result is −23.05 bps (t −2.47), and three of the four holdout years are negative.
What it means
As a fixed rule, the textbook pattern is no edge in these data, not even in its best, inverted form. The only recurring motif of the chart family, long momentum in Bitcoin 2017–2022, shows up in all five sub-families and did not survive the holdout.
Whatever a discretionary trader earns on top would have to come from things not mapped mechanically here: choosing days in real time, position size, reaction to news. Or it is variance with survivorship. None of that can be shown here, and the mechanical pattern rule is refuted.
Limits
- CFD minute data (bid). The candles are built from Dukascopy minutes, not from exchange volume, as a continuous series like a 24-hour CFD chart. Pure cash-session charts were not tested.
- Fixed cost model. Real fills are more likely worse, and the 10 bps for Bitcoin can be too low in hectic phases.
- One definition per pattern, time exits only. Other readings can give other numbers, but the breadth of 31,663 tests makes a missed large effect unlikely. Trailing stops and discretionary management are absent.
- Best direction per test. We score the better of the two directions, and the correction accounts for that. The tests overlap and are not independent.
- Neighbouring variant. A neighbouring variant of the Bitcoin pattern, computed after the peak was selected (t 5.51), formally passes the correction. We do not count it because it largely contains the same trades.
- One holdout run with 141 trades. Only the Bitcoin pattern was checked on the holdout, all other numbers come from 2015–2022. A positive effect below about 8 bps net cannot be ruled out (95% interval roughly −32 to +8 bps), the claimed 50 bps can.
- Not tested: HK50, JPN225, AUS200, SMI, daily and weekly candles, volume confirmation (Dukascopy provides only tick activity) and discretionary choice of days.
All pattern families of the scan in the overview. Related are the doji trap on the 2-minute chart, the 1h pin bars and the random-walk yardstick. The sister studies cover chart formations and VWAP and indicators.
Disclaimer: Historical statistics are no guarantee of future market behaviour. This study is not investment advice. Trading carries a risk of loss up to total loss.