Note, 29 September 2026: Part of the R values in this study comes from our older backtest chain, which also books positive R on a random market without direction. Those values are too high; results that do not depend on the chain (price statistics, counts) are unaffected. Details: The random market as a ruler.
Re-run, 5 October 2026: The 25 combinations of breakout rule and market from our rulebook have been re-measured on the corrected chain and on real broker ticks. None has an advantage over the random market; after costs the mean is −0.08 R per trade. The affected R values in this study are therefore not proven, the other results are untouched. All numbers: Our own breakout rules, re-measured.
Data basis: DAX, FTSE, NQ, DOW, 1h candles built from M1 data, cash-session candles only, 2015–2026, 12,949 pin bars, plus 20,430 benchmark candles. Exit: trailing stop BE 0.5 / TS 1.0 / step 0.5 on M15 buckets, horizon 2 trading days, net of spread and slippage. Lookahead-free: entry at the close of the completed candle. No trading recommendation.
The pin bar is perhaps the best-known reversal candle in the price-action literature: a long wick, a small body, price was rejected at a level. It almost always comes with the rule that the pin bar is only "activated" once the next candle closes beyond the pin extreme — the market confirms the rejection.
The question we started with had two parts: how strong is the 1h pin bar at all? And does it need the second close?
We measured both mechanically. The first answer is sobering, the second surprising — for a structural reason, not a statistical one.
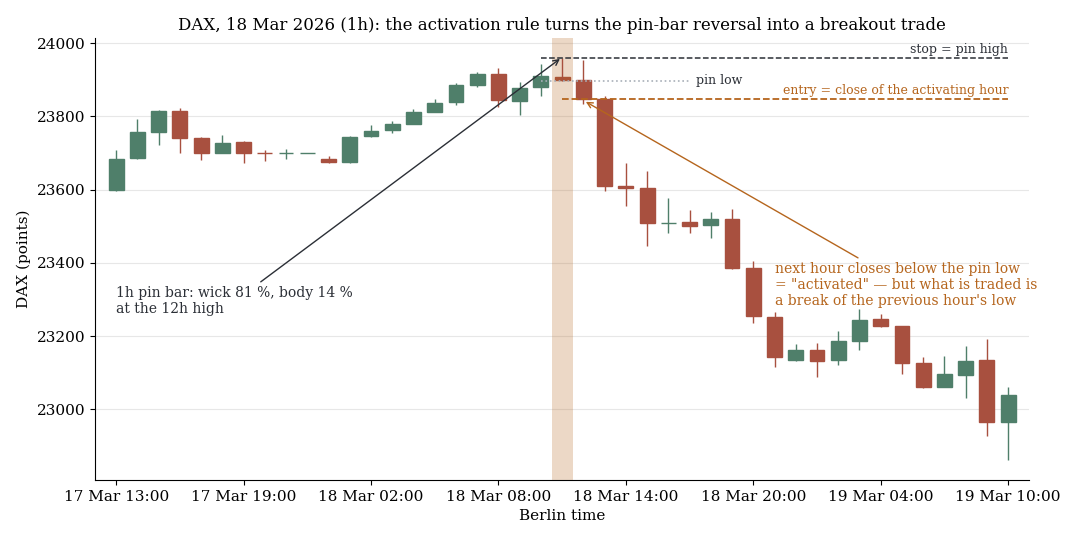
DAX, hourly candles: pin bar at the 12-hour high, the next hour closes below the pin low. The "activated" trade is a break of the previous hour's low with a wide stop, no longer a reversal.
1. The definition and the benchmark
For us a pin bar is a 1h candle with wick ≥ 60% of the range and body ≤ 30% of the range. Upper wick = bearish pin, lower wick = bullish pin. Only candles inside the cash session count. The trade goes against the wick, the stop sits at the pin extreme, the exit is the standard trail.
Three variants:
- A) Raw: entry at the pin bar's close.
- B) Activated: the next 1h candle closes beyond the pin extreme on the opposite side (bearish pin: below the pin low). Entry at that close, stop stays at the pin extreme.
- C) Unconfirmed: the next candle does not close beyond. Entry at its close.
Plus the subdivision "at the extreme": the pin high is also the 12h high (or low) — so the pin bar sits where a reversal should happen according to the textbook.
The benchmark is the decisive part. We applied the same bracket construction — entry at close, stop at the candle extreme, trail — to every eighth session candle, regardless of its shape, long and short side. That shows what bracket geometry and drift deliver without any candle logic. Without this comparison, every pin bar number would be worthless.
2. Raw: the pin bar is an arbitrary candle
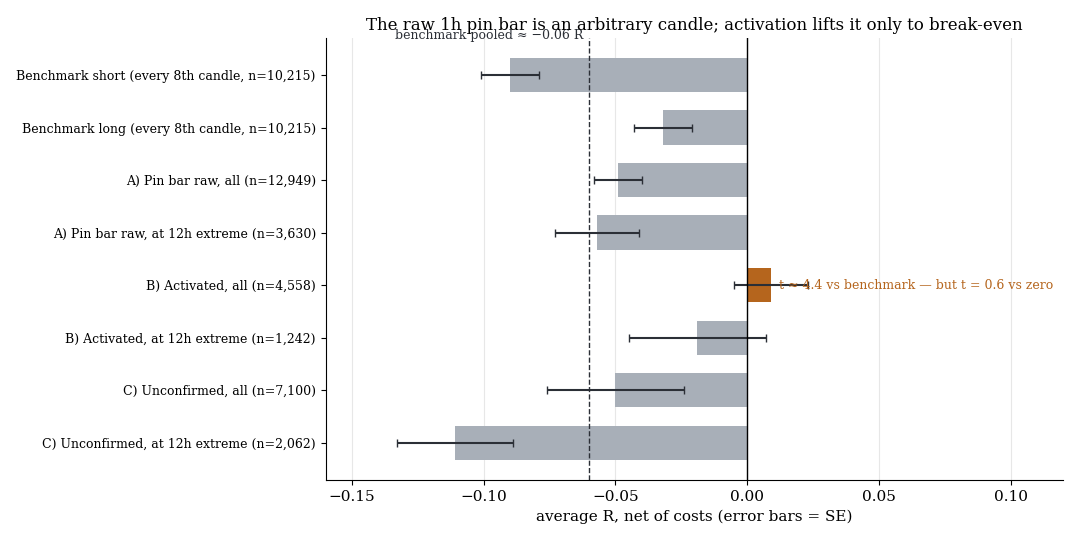
The raw pin bar sits on the benchmark of arbitrary candles; activation lifts it to break-even, not above.
| Variant | n | avgR | SE | Win rate |
|---|---|---|---|---|
| Benchmark short (every 8th candle) | 10,215 | −0.090 | 0.011 | 29% |
| Benchmark long (every 8th candle) | 10,215 | −0.032 | 0.011 | 32% |
| A) Pin bar raw, all | 12,949 | −0.049 | 0.009 | 31% |
| A) Pin bar raw, at 12h extreme | 3,630 | −0.057 | 0.016 | 32% |
The pooled benchmark sits at roughly −0.06 R (the long-short difference is the drift we know from the overnight drift study). The pin bar sits at −0.049 R. The difference to the baseline is around 0.01 R at t ≈ 1.0 — computed from the standard errors, not significant.
The raw 1h pin bar has no measurable advantage over an arbitrary candle with the same bracket geometry. The shape of the candle carries no information about what follows.
Location does not help either. At the 12h extreme — where the rejection should be most meaningful — the pin bar sits at −0.057 R, if anything slightly worse than anywhere else. This is the same pattern as in our reference candle shape study and in later tests: the shape of a candle is a proxy for its close, and the close alone is not a forecast.
3. Activated: the second close changes the result
| Variant | n | avgR | SE | Win rate |
|---|---|---|---|---|
| B) Activated, all | 4,558 | +0.009 | 0.014 | 34% |
| B) Activated, at 12h extreme | 1,242 | −0.019 | 0.026 | 32% |
| C) Unconfirmed, all | 7,100 | −0.050 | 0.026 | 30% |
| C) Unconfirmed, at 12h extreme | 2,062 | −0.111 | 0.022 | 30% |
Roughly one pin bar in three gets activated (4,558 of 11,658 with a following candle). This subset sits at +0.009 R — against the benchmark baseline of roughly −0.06 R that is a difference of about +0.07 R at t ≈ 4.4 (computed from the standard errors), against the raw pin bar +0.058 R at t ≈ 3.5. The filter is statistically real.
But it is only cost-covering. +0.009 R at SE 0.014 is indistinguishable from zero (t = 0.6). The second close lifts the pin bar from "loses like any candle" to "no longer loses" — not to "wins".
The unconfirmed variant is the flip side: −0.050 R overall, at the extreme −0.111 R (t ≈ −2.0 against the raw extreme cell). Anyone trading a pin bar at the 12h extreme whose next candle does not confirm the rejection is trading the worst cell in the table.
4. Why activation works — and why it is not a reversal edge
This is the actual finding. One has to look at what activation does geometrically.
A bearish pin bar has its wick at the top and its low at the bottom. Activation means: the next hour closes below the pin low. Entry is at that close, i.e. below the pin low, with the stop at the pin high. What is traded there is no longer a reversal. It is a break — price has broken the previous hour's low on an hourly close, and one goes with the break.
The pin bar now only supplies the stop level. The signal is the second close, and that is structurally the same as any other break of an hourly extreme. That is why the construction stops losing: with-the-break trades have sat above counter-trend trades in our data for years, and the activated pin bar is a with-the-break trade with an unusually wide stop.
The wide stop also explains why it stays at ±0.00. The stop sits at the pin extreme, the entry a full candle range plus wick further down. Risk per trade is large, the trail engages correspondingly late, and an ordinary break does not deliver enough distance to make this bracket profitable.
At the 12h extreme the activation effect even disappears again (−0.019 R, n = 1,242, t ≈ −0.9 against "activated, all" — not significant, but the wrong direction). That fits: at the day's extreme, a break of the previous hour is more often a range extension without follow-through.
5. What this means
The 1h pin bar in this mechanical form is not a signal. Raw, it is an arbitrary candle. Its well-known activation rule works — but not because the rejection is confirmed; it works because the rule quietly rebuilds the trade from a reversal into a break. What remains is a break setup with poor bracket geometry that covers its costs and nothing more.
This is the fifth test of a reversal construction in our data to end this way — after the reclaim of a broken level, the second break, the chop lockout and the anti-trade. Each time the result was either a baseline or a break in disguise. The lesson is not that reversal candles "do not work", but that their supposed edge, measured mechanically, either vanishes or turns out to be a momentum edge one can have more directly.
For methodology, the benchmark remains the most important point. Without the "every eighth candle" baseline, −0.049 R would have looked like a weak but existing pattern. With it, it is clear the pattern contributes nothing — the number is the bracket geometry, not the candle.
6. Limits
- One mechanical definition. Wick ≥ 60%, body ≤ 30%. Discretionary pin bar readers use context (trend, level, volume) that is not represented here. We tested the candle shape, not the eye.
- One exit. The standard trail is our reference mechanic. Fixed targets or session-end exits could look different — though earlier tests show no exit beating the trail in any setup.
- M15 buckets in the trail. Intrabar paths are approximated at 15-minute resolution. That is identical across all variants and does not affect the comparison, but it does affect absolute levels.
- No out-of-sample. There was no parameter to optimise; the definition was fixed before the test. A half-year decomposition was not done.
- Four indices, pooled. One market could deviate. At n = 12,949 and a 0.01 R difference to the baseline, a hidden single-market edge is unlikely but not ruled out.
- Cash-session filter coarse in UTC hours. Daylight-saving transitions shift the windows by an hour; that affects a few percent of candles.
📄 Full study as PDF: 7 pages incl. all tables, figures and limits (in German).
Disclaimer: Historical statistics are no guarantee of future market behaviour. This study is not investment advice. Trading involves risk of loss up to total loss.