Note, 21 October 2026: This series documents our former workflow on one continuous example, the breakout rule over the second 15-minute candle. Its numbers come from our older calculation chain, which books positive results even on a random market without direction (why). On the corrected chain the rule sits significantly below the random market in the DAX, FTSE and Dow, and in the Nasdaq 100 it cannot be told apart from it (re-run). The verdict therefore no longer reads “edge confirmed”. The one market that passed the gate here shows no advantage over the random market on the corrected chain and on real broker ticks either. Walk-forward and Monte Carlo on the same history did not detect this. Today an untouched holdout decides. The series stays online as documentation. How we test today: our workflow since October 2026.
Data basis: DAX / FTSE / NQ / Dow M5 + M1, Jan 2018 – Feb 2026, ~2,090 trading days per index. Ruleset: 2nd-candle break + Time-BE-60 exit (from the exit study), fixed, no in-sample optimisation, net of spread (1 pt + slippage). No trading recommendation.
In the algo pipeline this is Phase 3 — the validation gate. Entry, exit and filters were fixed in the exit-logic study (Phase 2). Now only one question counts: does the edge survive on data that did not contribute to the selection? Tested with four independent methods — out-of-sample, walk-forward, Monte-Carlo, deflated Sharpe. Because the ruleset is fixed (no parameter optimised in-sample), these tests are clean.
The strict gate requires four conditions simultaneously: (1) OOS PF ≥ 1.3, (2) ≥ 80% profitable walk-forward windows, (3) recovery ratio ≥ 2 (total-R / 95% shuffle-MaxDD), (4) bootstrap P(profitable) > 95%.
Why Time-BE-60 and not Time-BE-30? In the exit study (Phase 2) the total-R optimum was at ~30 min. Here we deliberately validate the more conservative BE-60: a later break-even intervenes less often, sits closer to the raw entry edge and preserves less of an in-sample optimum. BE-30 yields higher total-R but sits nearer the fitted peak — the stricter test demands the more robust variant, not the most profitable one.
1. Out-of-sample (locked data)
In-sample = 2018–2022, out-of-sample = 2023–2026 (never used for rule selection).

| Index | IS PF (18–22) | OOS PF (23–26) | Years profitable |
|---|---|---|---|
| NQ | 1.50 | 1.52 | 9/9 |
| DAX | 1.50 | 1.27 | 8/9 |
| DOW | 1.51 | 1.16 | 7/9 |
| FTSE | 1.50 | 0.84 | 5/9 |
In in-sample all four looked identical (PF ~1.50). Out-of-sample separates the wheat: NQ holds (1.52), DAX weakens (1.27), FTSE collapses to 0.84. The in-sample PF alone is worthless.
2. Walk-forward (rolling)
45 rolling 1-year windows (quarter step). Each window is its own mini-OOS test of the fixed ruleset.
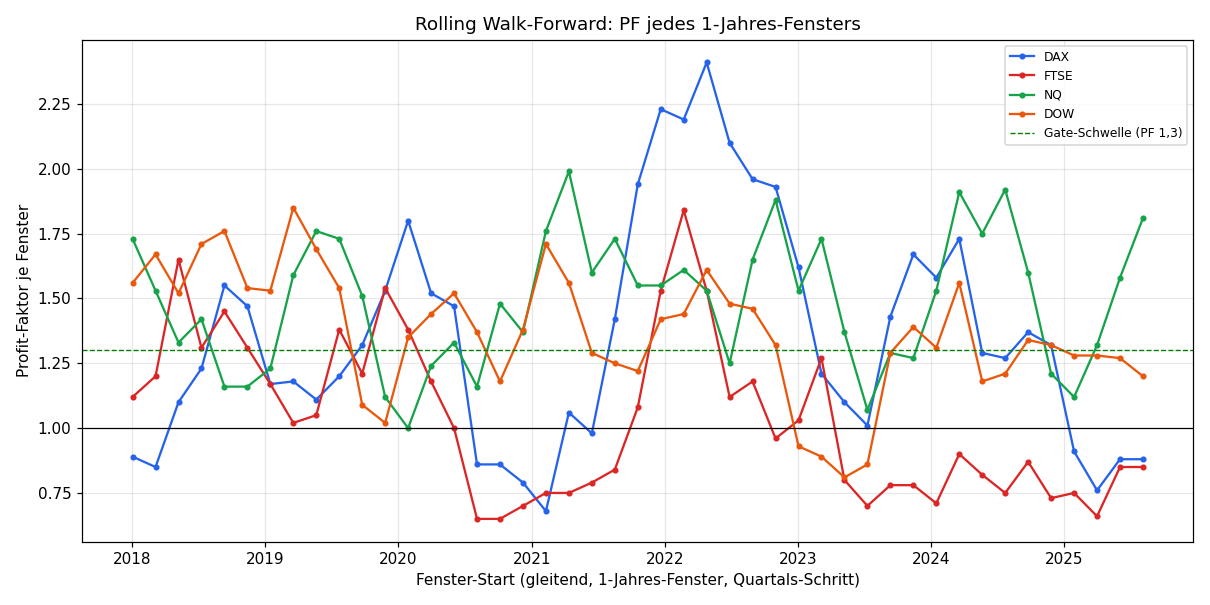
| Index | Windows | Profitable | Median PF | Min PF | Max PF |
|---|---|---|---|---|---|
| NQ | 45 | 100% | 1.53 | 1.00 | 1.99 |
| DOW | 45 | 91% | 1.37 | 0.81 | 1.85 |
| DAX | 45 | 76% | 1.29 | 0.68 | 2.41 |
| FTSE | 45 | 49% | 1.00 | 0.65 | 1.84 |
NQ passes in 100% of all 45 windows (even the worst still PF 1.00). DOW 91%, DAX only 76% (< 80% → gate missed), FTSE essentially a coin flip (49%).
3. Walk-forward (anchored)
Cumulative PF in an expanding window — shows whether the edge degrades over time.

NQ and DOW start high (cum. PF 2.1–2.4 in the early years) and converge to 1.50 / 1.37 — the edge weakens but stays stable above 1.3 for NQ. DAX settles at 1.30, FTSE crawls from 0.68 to only 1.01 — no viable edge.
4. Monte-Carlo (shuffle + bootstrap)
Two methods with different meaning:
- Shuffle (5,000 permutations): varies the order → how bad can the drawdown get purely from ordering bad luck? (The total sum is order-invariant — a shuffle alone therefore always gives P=100%.)
- Bootstrap (5,000 draws with replacement): varies the sample → distribution of the total result and true P(profitable).

| Index | Shuffle MaxDD q95 | Bootstrap total q05 | Bootstrap median | P(profitable) |
|---|---|---|---|---|
| NQ | 35 R | +263 R | +381 R | 100% |
| DOW | 44 R | +159 R | +275 R | 100% |
| DAX | 56 R | +106 R | +237 R | 99.9% |
| FTSE | 118 R | −112 R | +13 R | 56.5% |
The decisive value is the bootstrap P(profitable): NQ/DOW 100%, DAX 99.9% — robust edges. FTSE only 56.5% (coin flip) and a 5% quantile of −112 R — no tradeable edge.
5. Deflated Sharpe (multiple testing)
The exit was selected from 37 variants in-sample — that inflates any best value. The deflated Sharpe (Bailey/López de Prado) corrects for this. Under this strict bar the per-trade Sharpe does not clear the significance threshold — an honest caution: the high in-sample PF is partly a selection effect. The robust evidence is not the backtest PF but the OOS persistence + walk-forward consistency above.
6. Gate verdict
| Index | OOS PF≥1.3 | WF prof≥80% | Recovery≥2 | Bootstrap P>95% | GATE |
|---|---|---|---|---|---|
| NQ | ✓ 1.52 | ✓ 100% | ✓ 10.8 | ✓ 100% | ✅ PASSES |
| DAX | ✗ 1.27 | ✗ 76% | ✓ 4.2 | ✓ 99.9% | ❌ just fails |
| DOW | ✗ 1.16 | ✓ 91% | ✓ 6.3 | ✓ 100% | ❌ fails (PF) |
| FTSE | ✗ 0.84 | ✗ 49% | ✗ 0.1 | ✗ 56.5% | ❌ clearly fails |
Only NQ passes all four criteria. DAX is borderline (fails only the 1.3 bar and 80% WF), DOW fails on OOS PF, FTSE fails across the board.
7. Exit robustness: is the edge in the entry or the exit?
A single validated exit does not answer the decisive question: is the edge a property of the entry (2nd-candle break) — or just luck with this one exit? So the same gate (OOS + walk-forward + Monte-Carlo) runs on three structurally different exits: BE-60 (pure risk management), ONR-edge + BE60 and Asia-edge + BE60 (two level take-profits). This is not a re-selection — BE-60 stays the main system — but a declared stress test with a fixed trial count.

| Index | BE-60 | ONR-edge + BE60 | Asia-edge + BE60 | Gate passes |
|---|---|---|---|---|
| NQ | 1.52 ✓ | 1.44 ✓ | 1.42 ✓ | 3/3 |
| DOW | 1.16 | 1.12 | 1.12 | 0/3 |
| DAX | 1.27 | 1.18 | 1.13 | 0/3 |
| FTSE | 0.84 | 0.89 | 0.93 | 0/3 |
(OOS PF 2023–2026; ✓ = passes the full four-criteria gate)
Finding: NQ passes the complete gate under all three exits (OOS PF 1.42–1.52). This is the real proof — the edge survives a full swap of the exit mechanism and therefore sits in the entry, not in one specific exit rule. DAX, DOW and FTSE fail under every one of the three exits — no exit rescues an entry without an edge. This rules out that NQ's result is a BE-60 artifact.
Conclusion
- The in-sample PF lies — all four looked identical in-sample (1.50), only NQ survived every OOS test.
- Four independent tests agree: OOS, walk-forward and bootstrap Monte-Carlo all show the same ranking NQ > DOW ≈ DAX > FTSE.
- Only NQ passes the strict gate. DAX is borderline tradeable, FTSE is out.
- The edge is exit-robust. NQ passes the gate under three structurally different exits — the edge sits in the entry, not in one specific exit rule.
Only on this validated core does Phase 4 (position sizing/Kelly) follow → Position sizing & Kelly. The only truly clean final test remains the live forward test, since the OOS block stems from the same dataset (2018–2026).
Limitations: spread modelled (1 pt), slippage estimated — real only in forward testing. OOS from the same overall dataset; true OOS = live from today. Deflated Sharpe assumption-sensitive. Single-source data (Dukascopy). News events not covered.
📄 Full study as PDF · Part of the series: 2nd opening candle · Exit logic (Phase 2) · Position sizing (Phase 4)
Disclaimer: Historical statistics are no guarantee of future market behaviour. Not investment advice. Trading involves risk of loss up to total loss.