As of: 21 October 2026. This article replaces the methodology document of the series “From edge to EA” as the description of how we work. The series stays online as an archive with correction notes. No trading recommendation.
Since October 2026 we work differently from before. The reason is in two of our own studies. In September 2026 we ran our calculation chain of the time on a random market in which every minute candle is mirrored by a coin toss. Such a market has no direction, yet the chain booked almost the same profits there as on real data. We then re-measured our own breakout rules on the corrected chain and on real broker ticks: none of the 25 combinations of rule and market had an edge.
Walk-forward and Monte Carlo on the same history had not detected this. A pattern search with about 897,000 logged tests also showed how quickly one finds hits that are not real (overview). The following workflow came out of that.
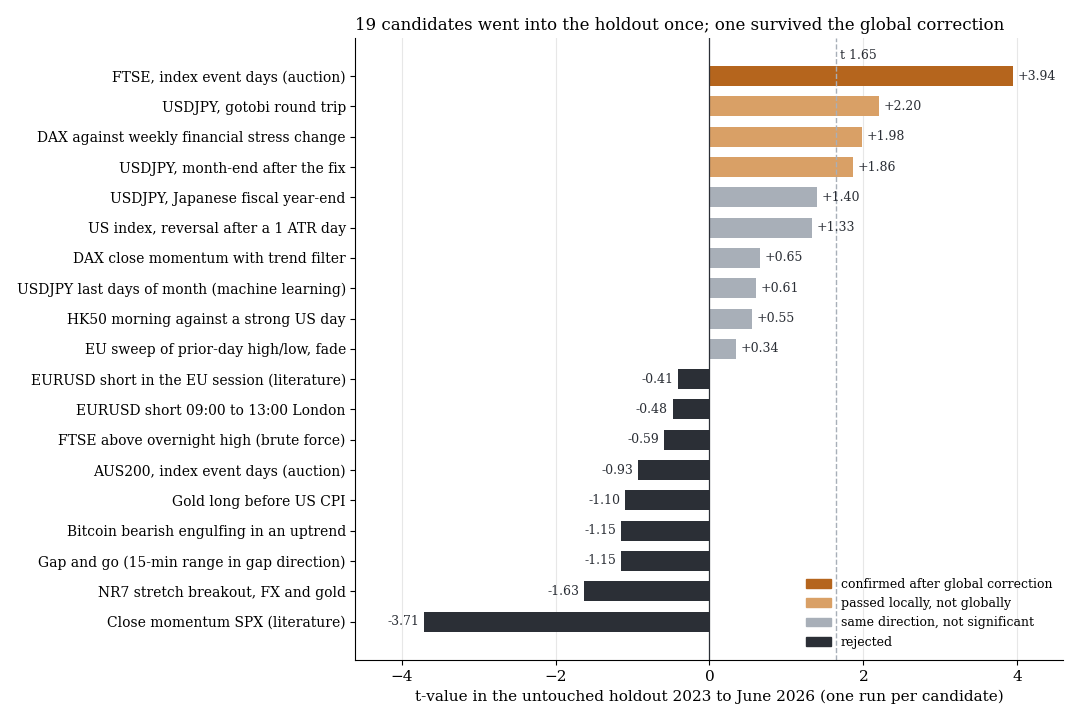
Holdout t-values of the 19 candidates of our large scan: all looked good in the search period, one survives the global correction.
1. Hypothesis only with a mechanism and a counterparty
The starting point is no longer a price pattern but a reason: who has to trade at a given moment, and who pays for it? The families we search in are forced flows such as index event days and fixings, liquidity provision after sharp pullbacks, insurance premiums, behavioural errors and slow processing of information.
One example is the index event day in the FTSE 100: passive funds have to trade rebalancing at the closing price, whatever the price. Indicator combinations “on a hunch” are no longer tested as candidates. Widely used indicator rules are still measured as a cross-check, pre-registered and with the same gate, most recently the cross of EMA(9) and VWAP.
2. Pre-registration with a checksum
Before a single row of data is loaded or bought, the following is written down: the question, the rule, the variants, the costs, the benchmarks and the gates. The file is locked with a SHA-256 checksum, and the study names the start of that checksum. Addenda are allowed, but only before the result, also locked and named openly in the study.
Two addenda from practice: Meta traded under the ticker FB until June 2022, and QQQ has no meaningful auction on NYSE Arca. Both were settled before the first evaluation and are stated in the studies (Nasdaq 100, SPY open).
3. Data: free first, then targeted
First we check what is freely available: FINRA short sale data, issuer fund data, Wikipedia page views, daily data. Data is bought only after a free price check and only for the time window the rule needs. For the auction studies that was about ten to fifteen minutes around each auction, not whole trading days.
4. Search period with a gate
Measurement first runs on older data only. A candidate has to clear three hurdles:
| Hurdle | Requirement |
|---|---|
| Size after costs | net t ≥ 2 after CFD spread, slippage and overnight financing |
| Multiple tests | Benjamini-Hochberg q ≤ 0.10 across all tests of its family |
| Benchmarks | better than random direction or random entries, than a random market with mirrored candles and than plain drift |
The t measures how far a mean sits above the noise. The q is the error probability adjusted for the number of tests. Most candidates end here, and these results are published too.
5. Data check before the holdout
This step is new. A candidate that passes the gate is recomputed on real CFD minute data before the holdout. On 21 October 2026 a pullback rule on EURUSD showed t 16 in the search period on freely available daily candles, a value that practically does not exist in markets. On CFD minute data the same rule was at zero. The source's daily candles were faulty. Without this check a data error would have gone into the holdout.
6. Holdout, exactly once
The latest years stay sealed. The holdout is opened exactly once per candidate, and a lock file prevents a second run. Then a global multiple-testing correction runs across all holdouts of the whole programme, not just those of one study.
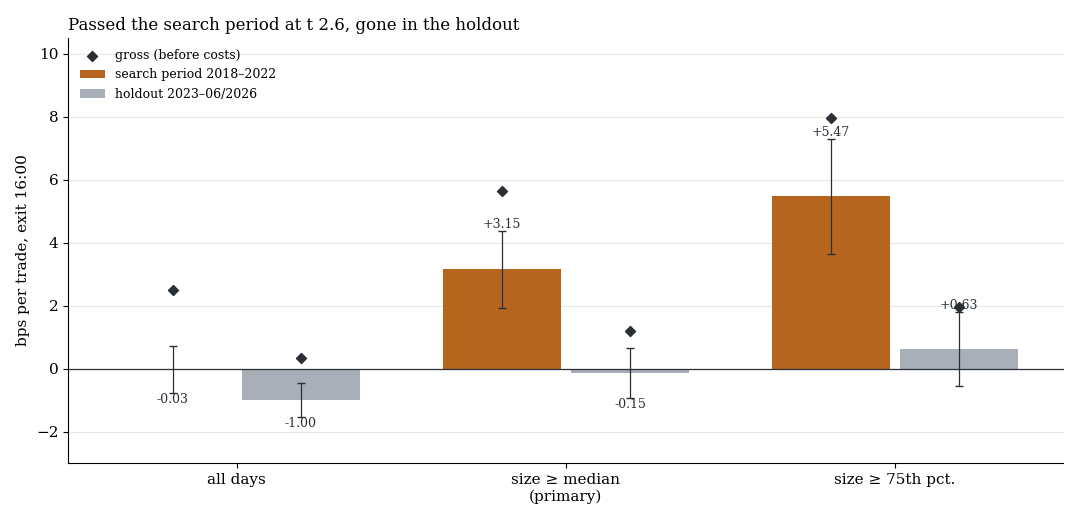
The closing imbalance of the 20 largest Nasdaq 100 stocks passed the gate in the search period (t 2.6) and sat at zero in the holdout. This is what most candidates look like.
As of 21 October 2026, 101 rules have been through the holdout, plus four filters that only predict the range. After the global correction two rules pass: the index event day in the FTSE 100 and the RSI(2) pullback on US index CFDs. The next best rule is at q 0.17.
7. Broker ticks, forward test, then money
A passed holdout is not yet permission to trade. First the rule is replayed in MetaTrader on the broker's real ticks, with the real spread. For the FTSE event day the broker ticks in the holdout gave +11.9 bps per event day, close to the +11.5 bps of the minute data. Then the rule runs as a paper or demo forward test on data that did not exist at test time. The Tokyo fix runs this way as a pre-registered forward test until September 2027 (study). Only after that does a rule trade real money.
8. The no gets published too
Every pre-registered measurement becomes a study on this site, with data basis, costs and limits. The verdict “no edge” appears in neutral grey, not red, because a negative result is a result. The overview of all holdouts is in the fresh scan overview.
What no longer applies
- Setup backtests on our old episode chain as evidence. The chain books random markets as positive too. Older studies based on it carry dated notes.
- “Edge confirmed” without an untouched holdout. On 21 October 2026 we re-labelled seven studies, including the five parts of the series “From edge to EA”. They stay online, with a note instead of being deleted.
- Walk-forward and Monte Carlo as the gate. On the same history they do not replace a holdout that was never looked at. We use them descriptively at most.
Limits of this workflow
- Power. A holdout of three and a half years can neither confirm nor rule out effects of one to two basis points. “Not confirmed” means “not demonstrable as a tradable rule”.
- Counting. The global correction depends on what counts as a holdout. We count every holdout run of a trading rule, including those on our own rules.
- Patterns from 2023 on. What only emerged in the holdout period, for example through zero-day options, cannot be found by a search period ending in 2022.
- Forward tests are slow. It takes months before a rule trades real money. That is the price.
All pattern families and holdouts in the overview. Related: the random market as a ruler and our breakout rules, re-measured.
📄 Full study as PDF: 6 pages incl. all tables, figures and limits (in German).
Disclaimer: Historical statistics are no guarantee of future market behaviour. This study is not investment advice. Trading carries a risk of loss up to total loss.