Data basis: Daily data of SPY, QQQ and DIA (Yahoo Finance) as stand-ins for US500, NAS100 and US30 CFDs. Search period 2000–2018 (419 trades), single holdout 2019 to October 2026 (206 trades; a window evaluated exactly once, after all rules were fixed). Costs per Pepperstone’s published conditions: 2 bps spread and slippage per round trip (1 bp = 0.01%), financing per night (swap: interest plus 2.5%, triple at the weekend) with 70% dividend credit. The risk calculation uses forward-CFD costs (3 bps plus interest). Benchmarks: entering on every day with the same holding time (the drift) and 1,000 random draws. No trading recommendation.
The rule comes from Larry Connors and Cesar Alvarez and has been published since 2008. It buys short, sharp pullbacks in an uptrend: the 2-period RSI, a momentum gauge between 0 and 100, falls below 10 while the close stays above the 200-day average. It buys at the close and sells at the first close above the 5-day average, after 20 sessions at the latest. The idea: after an overheated sell-off, an index in an intact trend usually snaps back quickly.
We test whether this has a positive expectation after costs on CFDs, with spread and overnight financing. In our scan the rule was an observation candidate, not a finding of the search period (see Limits).
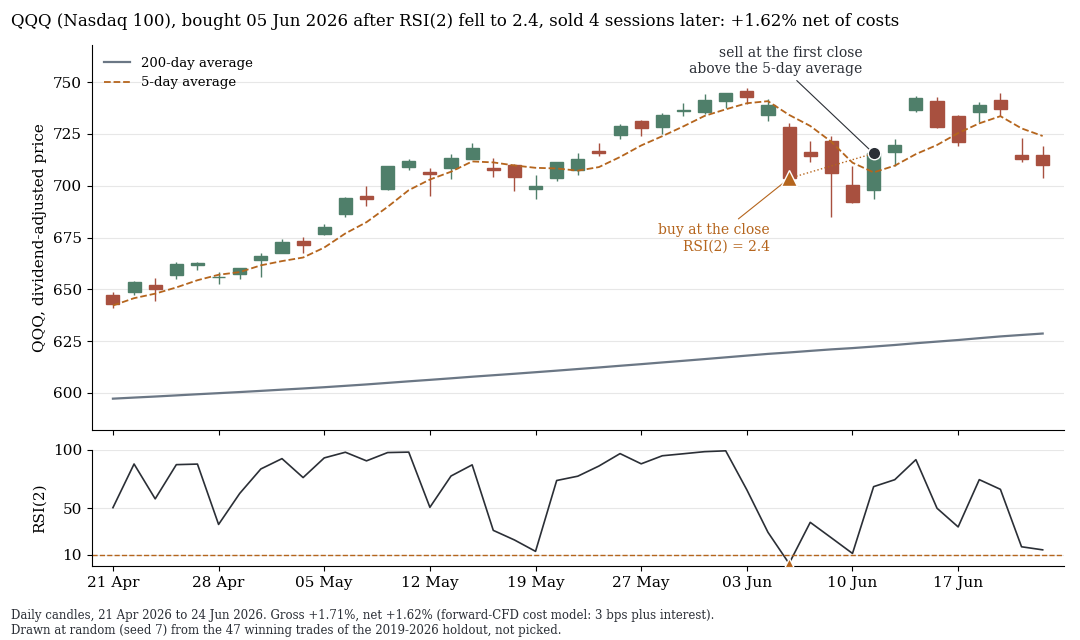
Winning trade in the Nasdaq 100 (QQQ as stand-in): RSI(2) at 2.4 on 5 June 2026, bought at the close, sold four sessions later at the first close above the 5-day average, +1.62% after costs. Both examples were drawn at random (fixed seed 7), not picked: this one from the 47 winning trades, the next from the 18 losing trades among the 65 Nasdaq 100 holdout trades of 2019–2026 (no stop).
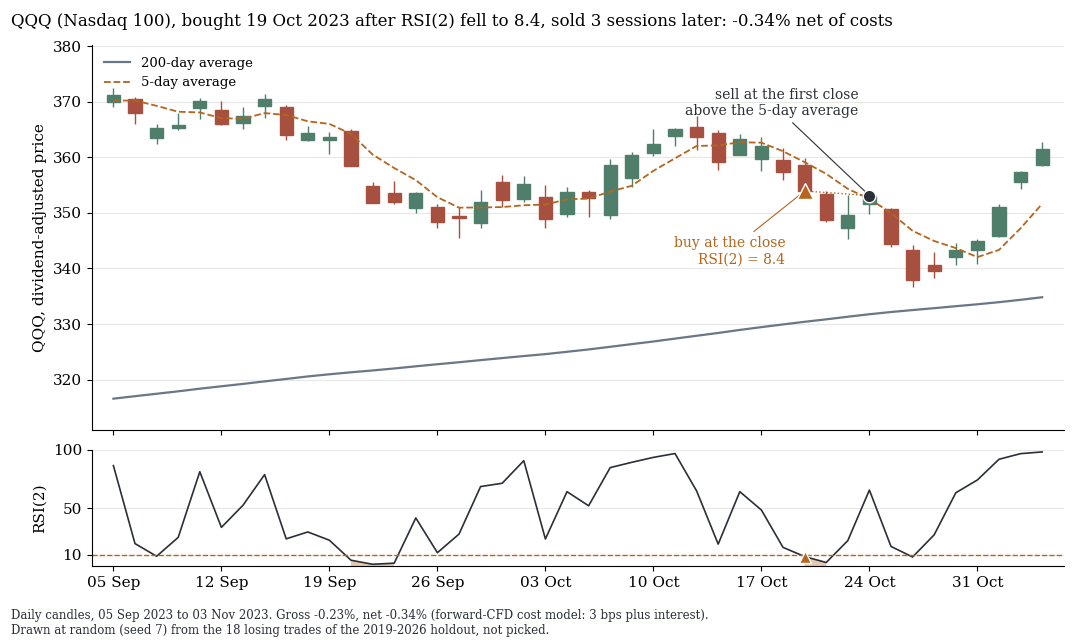
Losing trade: bought on 19 October 2023 at RSI(2) 8.4, sold after three sessions, −0.34% after costs. A typical small loss. The rare large ones are missing from the picture: the worst holdout trade across all three indices was −8.0% (February 2020).
1. The holdout: +48 bps per trade, +34 bps above random entries
In the search period none of three related pullback rules met all pre-set criteria. RSI(2) had the highest t but narrowly missed the year criterion (13 of 19 years positive instead of 14), and went into the holdout as an observation candidate. The t-values in brackets show how far a result lies above the noise, from 2 on it counts as notable.
| Search period 2000–2018 | Holdout 2019–2026 | |
|---|---|---|
| Trades (average holding time) | 419 (3.6 sessions) | 206 (3.4 sessions) |
| Net per trade (t) | +34.6 bps (3.1) | +48.3 bps (3.6) |
| Entering on every day, same holding time (drift) | +1.0 bps | +14.7 bps |
| Excess of the rule (t) | +33.6 bps (3.0) | +33.6 bps (2.4) |
| Years positive | 13 of 19 | 6 of 8 |
| At 1.5 times the spread | +33.6 bps | +47.3 bps |
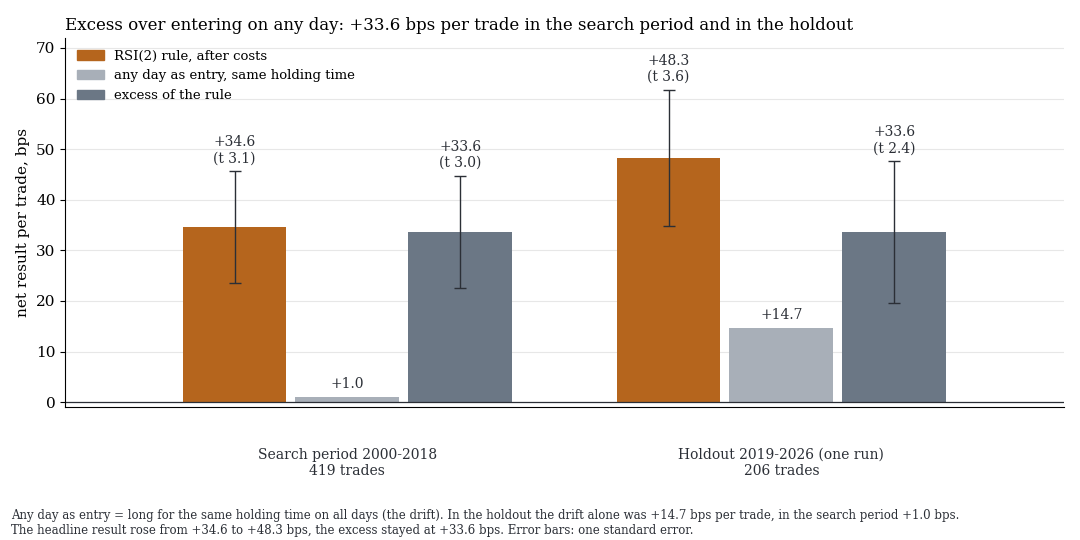
Net per trade with one standard error. The excess over entering on every day is +33.6 bps in both periods. The higher holdout result comes from the bull-market drift (+14.7 instead of +1.0 bps).
What matters is the excess. The net result rose from +34.6 to +48.3 bps in the holdout, but an arbitrary three-day buy already earned +14.7 bps in the bull market. The excess stayed at +33.6 bps (t 2.4), and the rule beat 98% of 1,000 random draws with the same holding time. After the global multiple-testing correction it stays confirmed (q = 0.005 across all 59 holdout tests as of 8 October 2026; q is the error probability adjusted for the number of tests). Two years were negative (2020 −38, 2022 −92 bps).
2. In risk units little remains
Bps per trade say nothing about risk. We therefore count in R: one R is the distance from entry to a far-off emergency stop, here three average daily ranges (ATR over 10 days). A trade at +0.10 R wins a tenth of what it risks down to the stop. We decided on stops only in the search period to 2018. The 2019–2026 figures are descriptive here, because the base rule’s holdout is used up.
| Market, emergency stop at 3 ATR | Trades per year (to 2018 / 2019–2026) | Avg R to 2018 (t) | Avg R 2019–2026 (t) | Worst trade in R (to 2018 / 2019–2026) |
|---|---|---|---|---|
| NAS100 | 8.1 / 9.1 | +0.07 (1.6) | +0.13 (2.5) | −2.68 / −1.20 |
| US30 | 8.0 / 9.9 | +0.09 (2.4) | +0.07 (1.1) | −1.05 / −1.20 |
| US500 | 8.0 / 9.2 | +0.14 (4.5) | +0.18 (3.3) | −1.06 / −1.25 |
With the emergency stop the return is +0.07 to +0.18 R per trade and about 8 to 10 trades a year per market. The profile is classic mean reversion. In the holdout to June 2026 (189 trades) the hit rate was 70% and the median +0.82%. The 1% quantile was −4.3%, though, and the worst trade −8.0%. About two thirds of the trades run over a weekend, and the index is in the market on about 11% of sessions.
3. Stops do not help the rule
We compared three variants: no stop, a stop at three and one at two ATR. The largest drawdown is the deepest fall of the summed R results.
| to 2018 | no stop: avg R, largest drawdown | stop 3 ATR: avg R, largest drawdown, stopped out | stop 2 ATR: avg R, stopped out |
|---|---|---|---|
| NAS100 | +0.11, −2.7 R | +0.07, −6.5 R, 12% | +0.14, 17% |
| US30 | +0.08, −2.9 R | +0.09, −2.4 R, 11% | +0.11, 20% |
| US500 | +0.14, −2.9 R | +0.14, −3.1 R, 9% | +0.18, 18% |
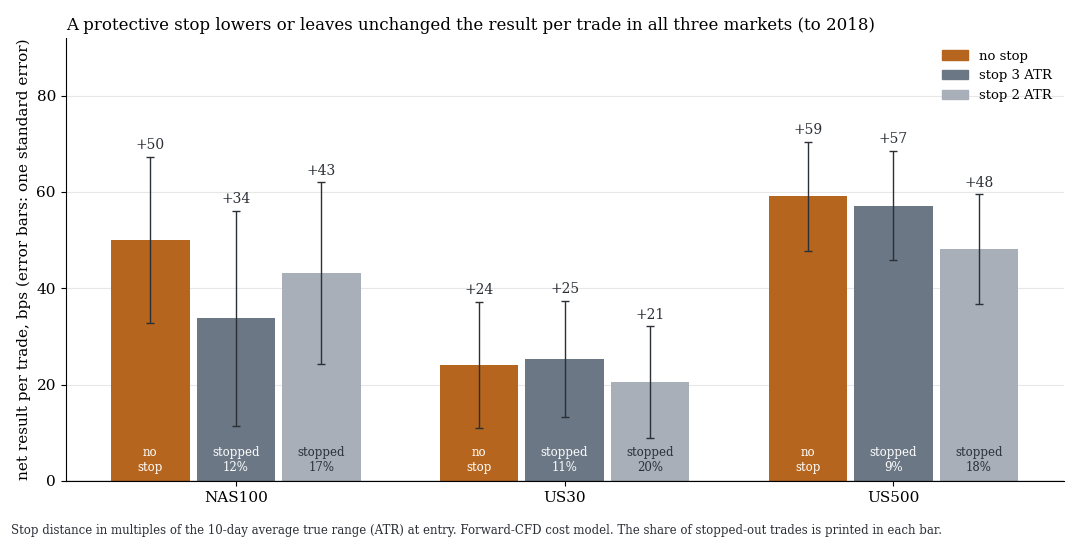
Net per trade in bps with one standard error, search period to 2018. The share of stopped-out trades is printed in the bars.
The stop at three ATR is triggered in 9 to 12% of trades and lifts the return nowhere. Per trade it brings +34 instead of +50 bps in the NAS100, +25 instead of +24 in the US30 and +57 instead of +59 in the US500. It caps the worst trade only in the US30 and US500 (−2.65 and −2.67 R without a stop, −1.05 and −1.06 R with one), and in the NAS100 the largest drawdown grows from −2.7 to −6.5 R. The tighter stop at two ATR hits 17 to 20% of trades and sits below the no-stop result in all three markets (+43, +21 and +48 bps). Its higher average R is a scale effect, because one R there is only two instead of three ATR.
4. Three markets are one signal, and the yearly return is small
The three indices mostly signal on the same day: in the holdout to June 2026, 189 trades fell on only 124 days. Anyone who risks 1% of the account per trade down to the emergency stop earns about 0.6% a year in the NAS100 to 2018 and 1.2% in 2019–2026. The largest drawdowns are −6.3% and −1.6%. With the whole account in the market (notional equal to account size) and no stop the figures are +3.8% a year to 2018 and +5.9% in 2019–2026, with worst trades of −8.1% and −4.7%.
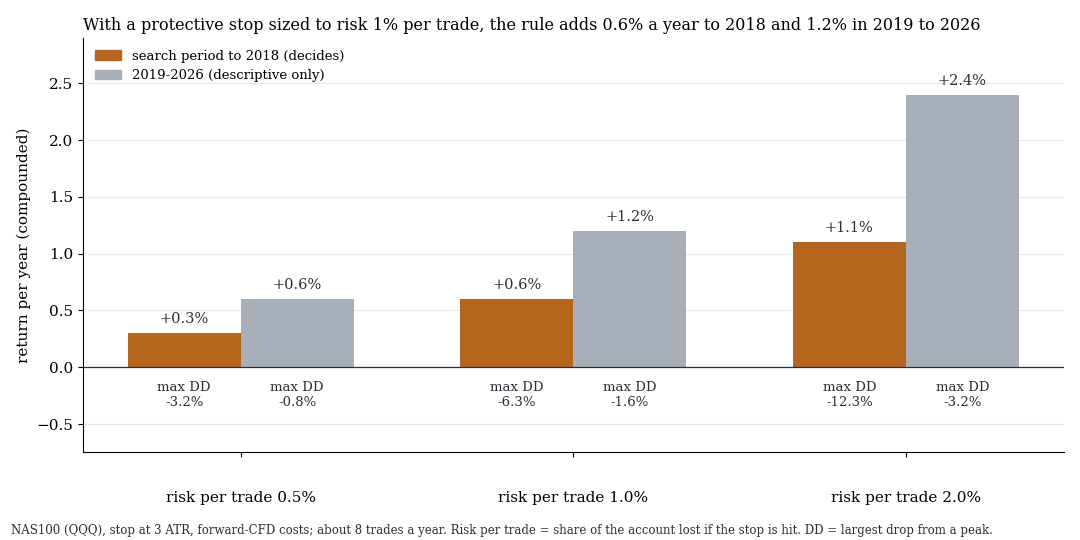
NAS100 (QQQ), stop at 3 ATR, forward-CFD costs, about 8 trades a year. Orange: the search period to 2018, which decides. Grey: 2019–2026, descriptive only. Below the bars the largest drawdown.
5. Counter-check: the same mechanism, no second confirmation
Our swing study contained a related pullback rule: in the Nasdaq 100, buy after three down closes above the 50-day average and hold five days. Search period to 2018: +70.1 bps per trade after costs (t 3.7, 215 trades). Holdout 2019–2026: +73.6 bps (t 1.8, 47 trades), but only t 0.9 against buy and hold at the same exposure, −12.2 bps with a one-day delay, and not confirmed globally (q = 0.20). Both rules rest on the same short-term reversal in an uptrend and therefore do not count as two independent confirmations.
What it means
The rule is no backtest artefact: it passed a holdout after costs, with the same excess in both periods. It is still smaller than +48 bps suggests. Part is bull market, in risk units it is +0.07 to +0.18 R at about 8 trades a year, stops do not help, and the three US indices are one signal. A small building block, not a business model, and no recommendation to trade it.
Limits
- Selection. RSI(2) was chosen among three related rules by the highest t and missed the year criterion. IBS (close in the lower fifth of the day’s range) and the 7-day low are also positive in the holdout (+16.2 bps, t 2.3, and +55.8 bps, t 2.8, descriptive). That points to a family effect but is no independent second test. The global correction does not cover this preselection.
- Bull market and age. In 2019–2026 any arbitrary three-day buy earned +14.7 bps, so the excess is the more honest number. The rule has been published since 2008 and survived that, but crowding and decay remain possible.
- Cost model. The interest rate is a proxy, the 70% dividend credit an assumption. 2 bps is conservative on normal days, not on crash days with gaps. ETF prices stand in for the CFDs (basis, fund costs of 0.1 to 0.2% a year).
- Execution. Entry and exit at the official close. CFD prices 5 or 10 minutes later cost −0.6 bps (t −0.5) or −0.4 bps (t −0.2) per trade (216 trades to June 2026, BID only, described after the holdout).
- Risk calculation. Dividend-adjusted prices, stop fill at the stop (at the open on gaps), no time limit (the base calculation limits to 20 sessions), markets calculated individually.
- Not tested: position sizing in drawdowns, other markets (FTSE, Nikkei, gold), entries before the close or the next morning. The short side and the DAX show no edge (RSI(2) short in the US +12.2 bps, t 0.2, DAX long +23.7 bps, t 1.2).
All pattern families of the scan in the overview. Related: swing patterns after CFD financing, the overnight effect and CFDs and published anomalies net of costs.
📄 Full study as PDF: 9 pages incl. all tables, figures and limits (in German).
Disclaimer: Historical statistics are no guarantee of future market behaviour. This study is not investment advice. Trading carries a risk of loss up to total loss.