Data basis: Eight equity indices (S&P 500, Nasdaq-100, Dow, DAX, FTSE 100, Nikkei 225, Hang Seng, ASX 200; data start between 1962 and 1992) and gold (via the GLD ETF, from 2004), daily data from Yahoo Finance. Search period: data start to 2018, physically separate holdout 1 January 2019 to 2 October 2026, one run per candidate. The 4-hour patterns and a follow-up run on Dukascopy CFD minute data (search period 2015–2022, holdout 2023 to 5 June 2026). Costs: spread and slippage (1.6 to 5.1 bps per round trip in the daily model), overnight financing by the Pepperstone formula, dividend adjustment. Benchmarks: buy and hold of the same exposure, 1,000 random entries, bootstrap random market (real daily bars reshuffled in blocks, drift kept). No trading recommendation.
Swing trading is seen as the calmer route to an edge: daily and weekly candles carry less noise, and the spread weighs less. Patterns on higher timeframes should therefore be stronger than the intraday patterns that came out at zero after costs in the September scan. The argument forgets one item: whoever holds a CFD overnight pays overnight financing (the swap), and it grows with every night.
We wrote down five families in advance: breakouts (for example a close above the 20-day high), pullbacks in a trend (for example the third down close in a row above the 50-day average), candle patterns at extremes (inside bar, NR7 as the narrowest range of seven days, engulfing, hammer, key reversal), calendar holding (turn of the month, day before a holiday, weekdays) and momentum, plus 4-hour patterns. Every combination of rule, holding period, side and market counts as one test: 1,920 on a daily and weekly basis, 500 on 4-hour bars. Results are in basis points per trade (bps, 1 bps = 0.01%). A holdout is a separate period that only the candidates chosen in advance run through, once. Buy and hold of the same exposure is a permanent position of the same average size as the rule's, and it separates a pattern from the mere upward drift.
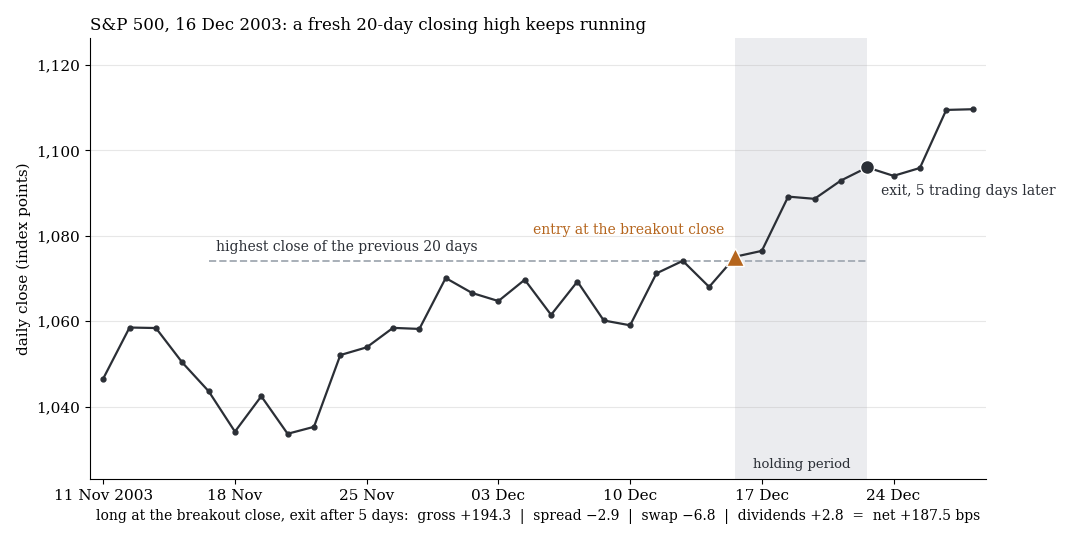
S&P 500, 16 December 2003, daily closing prices: gross +194.3 bps, net +187.5 bps after spread (−2.9), swap (−6.8) and dividends (+2.8). Both examples were drawn at random with a fixed seed (7) from all 6,118 fresh 20-day breakouts of the eight indices in the search period, one with a gain and one with a loss after costs.
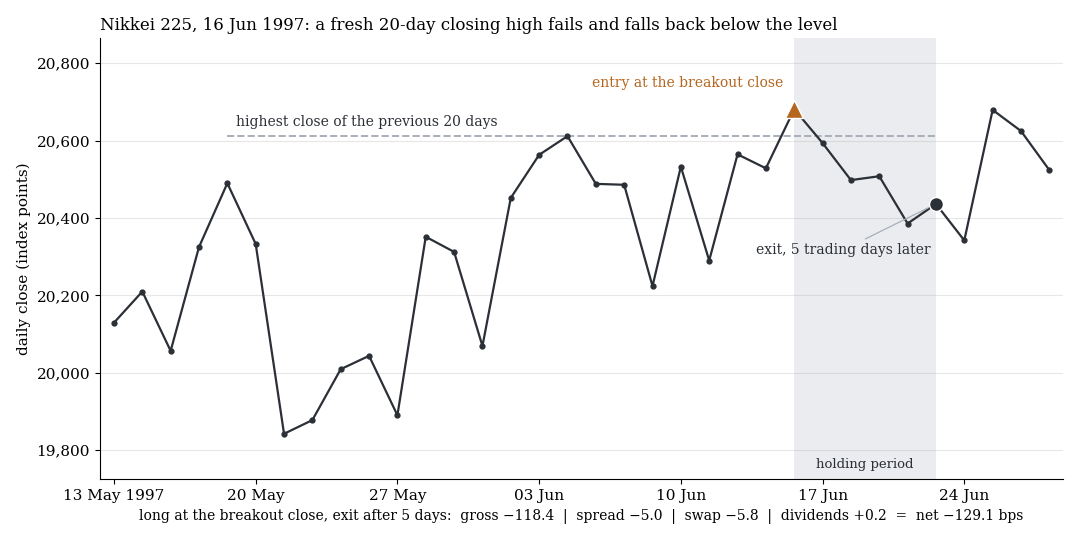
The counterexample: Nikkei 225, 16 June 1997, gross −118.4 bps, net −129.1 bps. The swap costs 6 to 7 bps in both cases, the price decides the result.
1. The Swap Grows With Every Night
Pepperstone charges index CFDs per calendar night: nights × price × size × (reference rate ± 2.5%) / 360. Long pays the rate plus 2.5%, short receives the rate minus 2.5%, a Friday night counts triple, for gold it is Wednesday. Dividends are credited to longs and debited to shorts (sources: Costs & Charges 02/2025, index fees page 08/2026, the broker's symbol list of 4 August 2026). According to Pepperstone, forward CFDs carry no additional overnight financing; it is included in the spread.
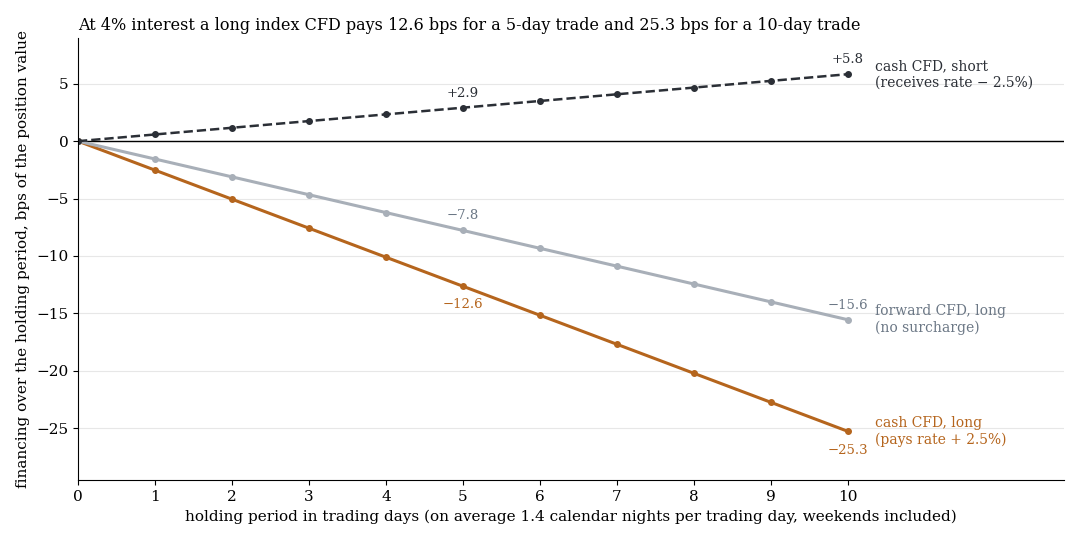
Formula calculation at a 4% rate, on average 1.4 calendar nights per trading day. The forward CFD is modelled with the interest component only.
For the median long rule of the search phase at a 5-day holding period, the gross move was +17.5 bps, financing −10.8 bps and dividends +3.5 bps, leaving +6.6 bps net. Financing thus eats 62% of the gross move, at 10 days 70%. After the dividend credit, 42 to 49% remain as a burden. A weekend is especially expensive: long from Friday to Monday made −0.15 bps gross on the eight indices, cost three nights of swap (−5.5 bps) and ended at −7.95 bps (t −5.8).
2. After Costs the Drift Remains
In the search phase long rules often earn a little net, short rules almost never: depending on the family, 48 to 65% of the long rules end net positive, but only 7 to 21% of the short rules.
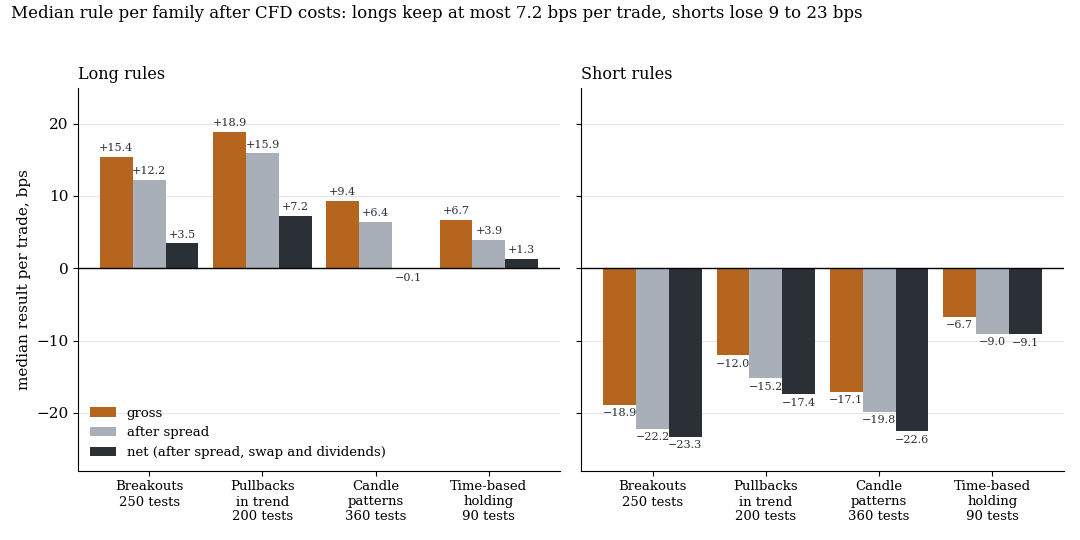
Search phase, median per family over all tests (250, 200, 360 and 90 per side). Net means after spread, swap and dividend adjustment.
This is index drift, not a pattern: longs run with the rise of the indices, shorts against it. Momentum is beta too: the long trend rules of the eight indices reach net t 2.3 to 3.2, but against buy and hold only t 0.8 to 2.1, as with trend following in gold. None of the 210 gold variants reaches t 3 (best t 2.2). Of all 6,628 logged tests (all periods together), 119 have a q ≤ 0.10 (Benjamini-Hochberg correction). 99 of them are significantly negative, only 20 positive. On CFDs, what is significant is mostly losing.
3. The Holdout: Market Return Instead of Pattern
Nine of 1,920 tests met all twelve candidate criteria set in advance: five candidates and two observations (the best variant of a family without a candidate), one holdout run each. Six of the seven end net positive.
| Rule | Search: net per trade | Holdout: net per trade (t; n) | Excess t | q global |
|---|---|---|---|---|
| Nasdaq-100: third down close above the 50-day average, 5 days | +70.1 bps | +73.6 bps (1.81; 47) | 0.92 | 0.20 |
| 8 indices: third down close above the 200-day average, 5 days | +27.7 bps | +25.2 bps (1.58; 528) | 0.35 | 0.24 |
| Hang Seng: weekly key reversal, 5 days | +202.6 bps | +65.7 bps (0.61; 11) | 0.61 | 0.49 |
| 8 indices: turn of the month | +29.5 bps | +18.7 bps (1.00; 736) | 0.17 | 0.45 |
| 8 indices: day before a holiday | +7.9 bps | +8.0 bps (1.52; 527) | 0.75 | 0.24 |
| 8 indices: close above the 20-day high, 1 day (observation) | +3.8 bps | +4.9 bps (1.69; 1,315) | 0.24 | 0.22 |
Seventh test: momentum short in the Nikkei 225, 5 trades, −0.26 bps excess per day (q 0.85). Eighth: 4-hour hammer, see section 5.
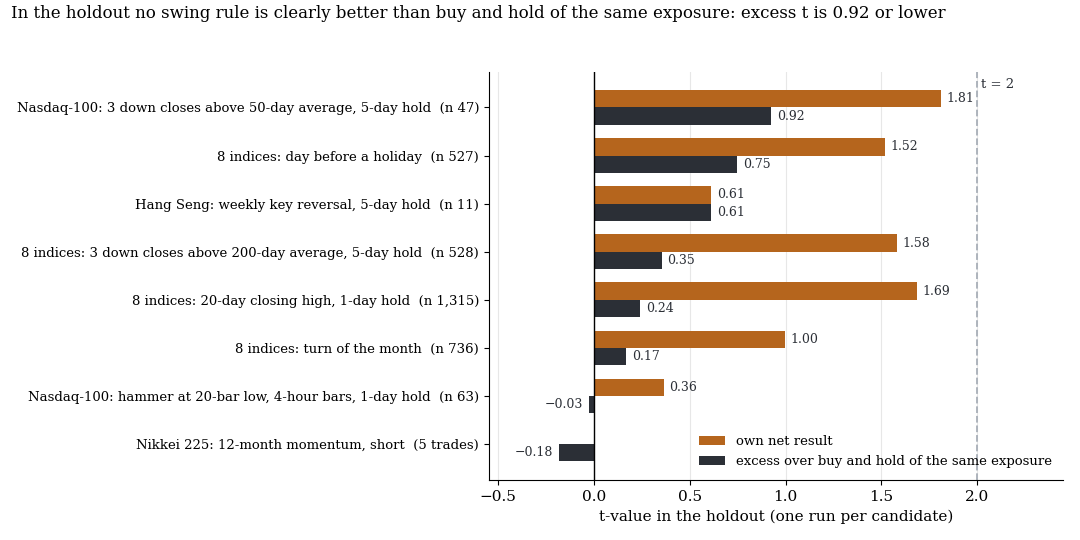
Holdout 2019 to 2 October 2026 (4-hour hammer: 2023 to 5 June 2026). Orange: t-value of the rule's own net result, dark: t-value of the excess over buy and hold of the same exposure, dashed: t = 2.
Buy and hold of the same exposure already delivers 84% of the holdout result for the turn of the month, 85% for the 20-day high, 80% for the pullback on the eight indices, 52% before holidays and 50% for the Nasdaq pullback. No excess reaches t 1, and the global multiple-testing correction across all holdout tests of the scan lets none of the eight through (q 0.20 to 0.85, threshold 0.10).
4. The Best Lead: Pullbacks in the Nasdaq-100
The rule: buy the Nasdaq-100 above its 50-day average after the third down close and hold for five days. It made +70.1 bps in the search and +73.6 bps in the holdout (t 1.8; 47 trades in 7.75 years). That is not a confirmation: about half comes from buy and hold, the excess has t 0.92, globally q is 0.20, and with a one-day delay the holdout gives −12.2 bps. Mechanically it is a short-term reversal in an uptrend, as in the RSI(2) study. The two count as one lead, not as two confirmations. We rate the rule as the best lead, mostly market return: the other half cannot be statistically separated from zero.
5. Calendar and 4-Hour Patterns
| Rule (8 indices, long) | Search to 2018 | Holdout 2019–2026 | CFD minutes 2015–2022 | CFD minutes 2023–06/2026 |
|---|---|---|---|---|
| Turn of the month | +29.5 bps (t 4.25) | +18.7 bps (t 1.00) | +8.8 bps (t 0.49) | +0.05 bps (t 0.00) |
| Day before a holiday | +7.9 bps (t 3.69) | +8.0 bps (t 1.52) | +17.7 bps (t 2.61) | +9.6 bps (t 1.27) |
The turn of the month (buy at the close of the second-to-last trading day of the month, sell at the close of the third trading day of the new month) was the strongest finding in the long history and shrinks with every window. The day before a holiday is smaller but positive in all four windows and significant in none: an observation.
The 4-hour patterns (breakout, inside bar, engulfing, hammer) ran on CFD minute data in the 2015–2022 search period. Of 500 variants one reaches t ≥ 3, 52 sit at t ≤ −2. The one lead, a hammer at the 20-bar low in the Nasdaq-100 (+43.9 bps; t 3.2), fails the correction (q 0.12) and the 2023 to June 2026 holdout (+7.9 bps; t 0.36). Re-running all daily rules on the minute data (2,100 tests per period) gives t ≥ 3 in 0 cases in 2015–2022 and in 3 cases in 2023–2026: chance level.
What it means
Swing trading on index CFDs is drift minus carry. Buy and hold captures the upward drift without daily spreads, and the swap takes a piece back every night. After costs, patterns on higher timeframes are no stronger than intraday patterns. What remains are two observations, the Nasdaq pullback and the day before a holiday, not trading rules.
On costs, as plain information: forward CFDs save the 2.5% surcharge and are cheaper than cash CFDs in the sum of spread and financing after about one night for US500, NAS100, US30 and GER40, and after four to five nights for UK100, HK50 and AUS200. On prop firms, as general information only: the FTMO FAQ (as of 30 September 2026) allows holding positions overnight and over the weekend in the evaluation phase of the standard account, but not over the weekend in the funded account, and the swing account has no such restriction.
Limits
- Cash prices instead of CFD prices. Entry at the signal close is idealised: for the Nasdaq pullback the sign flips with a one-day delay. The minute data (Dukascopy, BID) show no real spreads in the closing minutes.
- Cost model. Today's 2.5% surcharge is applied to up to 61 years of history, although there were no CFDs earlier. Early interest rates are policy rates, dividends are back-filled from ETF distributions, withholding tax is missing. The assumed spread is mostly 4 to 6 times today's average spread. With half the spread, the excess over buy and hold stays insignificant.
- Test power. 7.75 years of bull market can neither confirm nor exclude effects of 5 to 10 bps per trade. The US indices are almost one draw. Old index series have unusable opening prices (closing prices only), candle patterns do not run for the FTSE 100 and ASX 200.
- Not tested: leverage, position sizes, drawdowns, rule combinations, stock CFDs, FX swing, historical swaps.
All pattern families of the scan in the overview. Related: overnight effect with CFDs, month-end effect, published anomalies net of costs.
📄 Full study as PDF: 9 pages incl. all tables, figures and limits (in German).
Disclaimer: Historical statistics are no guarantee of future market behaviour. This study is not investment advice. Trading carries a risk of loss up to total loss.