Data basis: DAX, FTSE, CAC, SMI, Dow, NQ, SPX, JPN225, AUS200, EURUSD, GBPUSD, USDJPY and gold; Dukascopy CFD minute data (BID). Search period 2015–2022, every rule run once. A holdout from 2023 to June 2026 went only to the three rules that were left standing after the search (one run each). Costs: spread plus slippage per market, round trip about 1 to 5 bps, indices outside cash hours ×2.5. Benchmarks: random markets (every minute candle mirrored at its open with probability ½: same volatility, no direction), placebo levels, “always long”. No trading recommendation.
What appears in an academic journal counts as checked. The papers offer an explanation, t-values above 4 and a return in percent. Most charge no spread, and they end years before today. After publication, effects wear off: McLean and Pontiff find about 58% less return for stock anomalies.
We read seven papers, wrote down each paper's rule before the first run and ran it once on our minute data. An eighth paper, Ito and Yamada on the yen fixing, continues as a pre-registered forward test: Tokyo fix study.
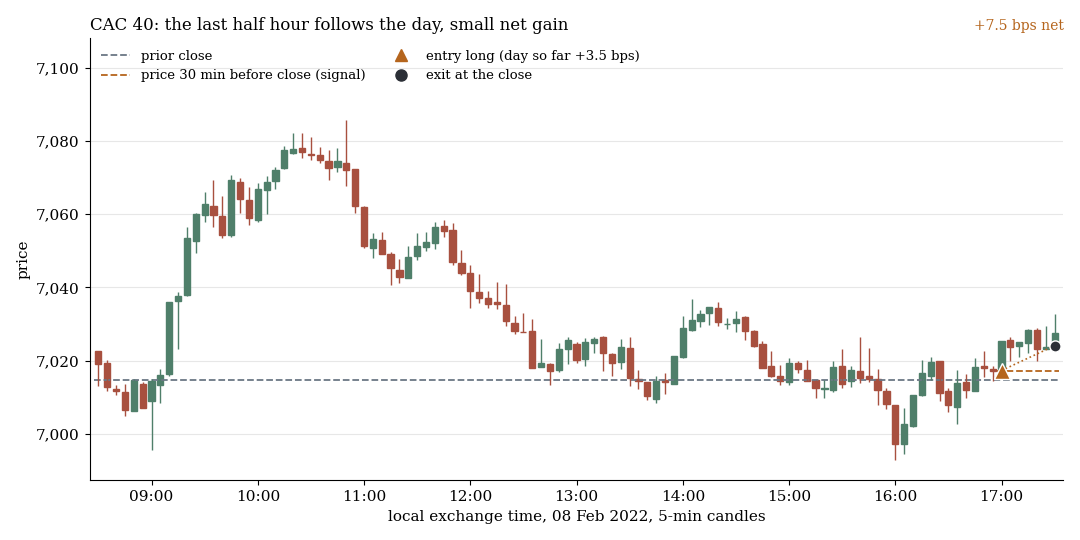
Rule of Baltussen et al. (2021): if the market is above the prior close 30 minutes before the close, the rule goes long for the last half hour, otherwise short. CAC 40, 8 February 2022: day return +3.5 bps, result after costs +7.5 bps.
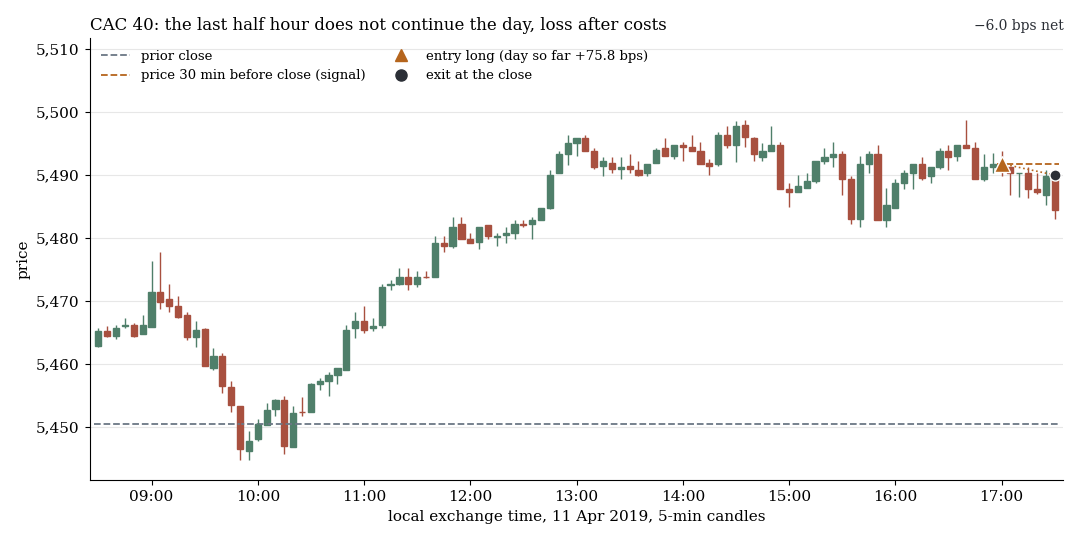
CAC 40, 11 April 2019: the day ran +75.8 bps higher, the last half hour did not continue it, result after costs −6.0 bps. Both examples come from the 2015–2022 search period and were drawn at random from all detected cases with a fixed seed, not picked.
1. What is left of the seven papers
| Paper | In the paper | Our gross | Our net |
|---|---|---|---|
| Baltussen et al. (2021): last half hour follows the day | Sharpe 1.73, 6.9% p.a. | +1.15 bps per day (t 3.5), about 40% of the paper | −1.89 bps (t −5.7) |
| Lucca/Moench (2015): rise before FOMC dates | +49 bps in 24 hours (t > 4.5) | +19.8 bps (t 2.3), without the 5 best days t 0.5; intraday +0.6 bps (t 0.15) | 24 hours +16.9 bps (t 1.8); intraday −2.2 bps (t −0.4) |
| Breedon/Ranaldo (2013): EUR/USD falls in the European session | −0.084 (annualised log return) | −0.067, i.e. 80%; +2.65 bps per day (t 4.1) | +1.50 bps (t 2.35); holdout −0.34 bps (t −0.41) |
| Osler (2003, 2005): prices reverse at round numbers | reversal more often than at arbitrary levels | bounce 43.8% instead of 47.5% at placebo levels (t −5.3) | fade at the level −2.8 bps (t −28) |
| Lou/Polk/Skouras (2019): trend following earns only overnight | 1.40% per month (t 3.24) | overnight +0.9 bps (t 0.8), intraday −1.8 bps (t −1.7) | intraday −4.6 bps (t −4.3) |
| Etula et al. (2020): month-end liquidity, then reversal | selling pressure, then recovery | reversal days long +4.7 bps (t 1.3) | +1.7 bps (t 0.45) |
| Boyarchenko et al. (2023): overnight drift | +1.5 bps per day (t 7.1) | +1.20 bps (t 2.9), about zero since 2017 | −5.5 bps (t −13.4) |
Gross, four replicate in essence: Baltussen, Lucca/Moench in the paper's window, Breedon/Ranaldo on EUR/USD and Boyarchenko, mostly at 40 to 80% of the published size. Osler holds only half, Lou/Polk/Skouras and Etula do not replicate. Net, none holds. The effects tradeable intraday are 1 to 3 bps, a round trip costs 1 to 5 bps.
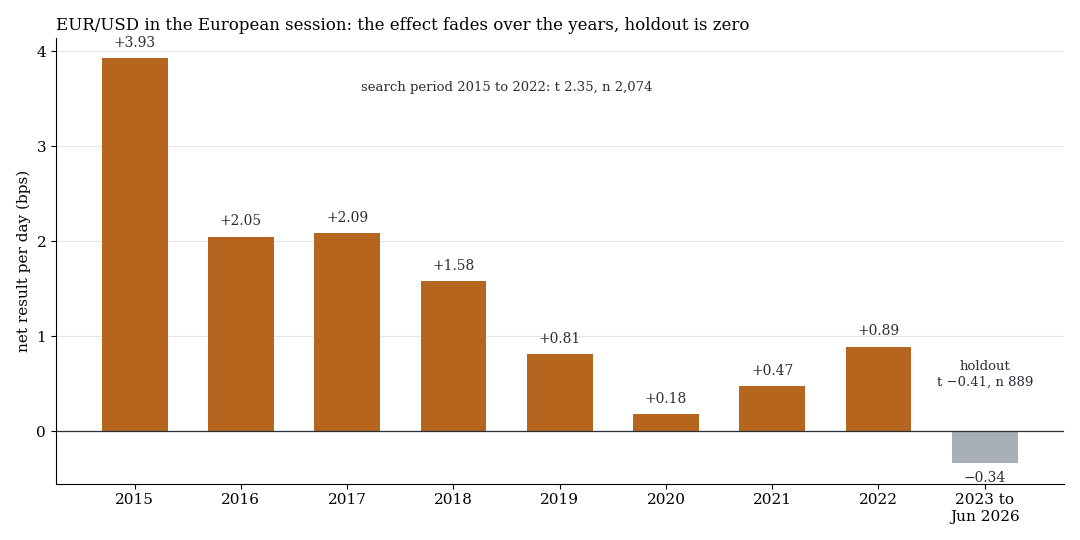
Breedon/Ranaldo on EUR/USD: net result per day for each year of the search period (orange) and in the 2023 to June 2026 holdout (grey). Search period t 2.35 over 2,074 days, holdout t −0.41 over 889 days.
2. The last half hour: small gross, negative net, reversed in the holdout
Baltussen et al. explain the rule with option dealers who have to hedge in the direction of the day before the close.
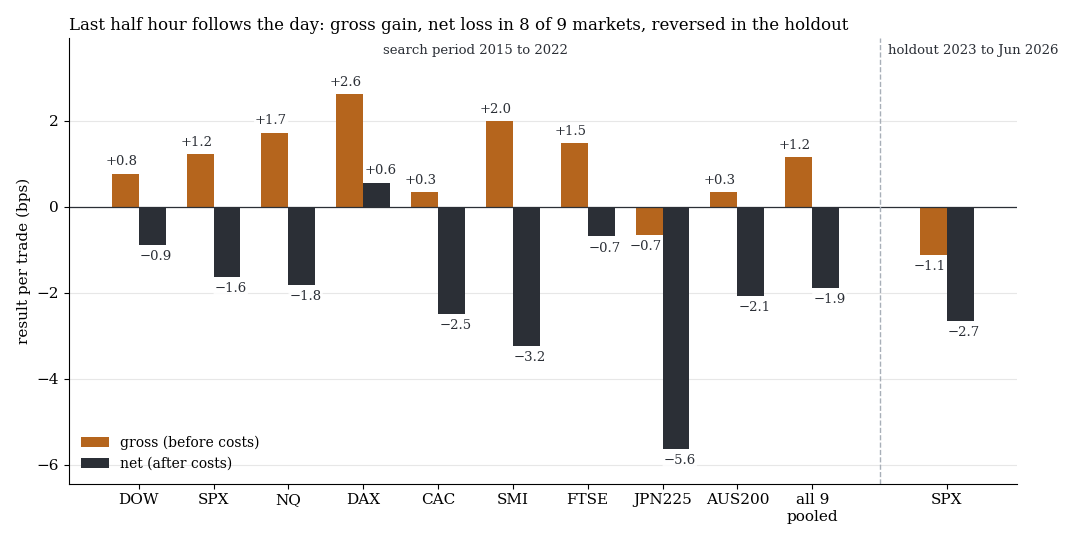
Orange: result per trade before costs, dark: after costs. Left the nine indices of the 2015–2022 search period and pooled (16,731 trades), right the SPX holdout (788 trading days, 2023 to June 2026).
Pooled, the rule earns +1.15 bps gross (t 3.5), in Europe +1.60 bps (t 4.1). After costs, −1.89 bps remain (t −5.7). Only the DAX is positive net (+0.56 bps, t 0.72), and the effect hangs on 2020.
In the SPX holdout (one run) the result is −2.65 bps per trade, t −3.71, hit rate 43.0%. That is not noise around zero. The market tended to turn against the day's direction into the close (gross −1.12 bps), and 94% of random directions beat the rule. Whether zero-day options have anything to do with it is a guess we have not tested.
We could not test the paper's gamma condition (momentum only when option dealers are short gamma): our gamma file reports short gamma on almost every day, on 498 of 502 days in 2021–2022. The holdout was therefore effectively the unconditional rule.
3. Round numbers: prices break through instead of bouncing
Osler explains support and resistance with orders: take-profit orders cluster at round numbers, stop orders just behind them. Prices should reverse there more often and accelerate after a break.
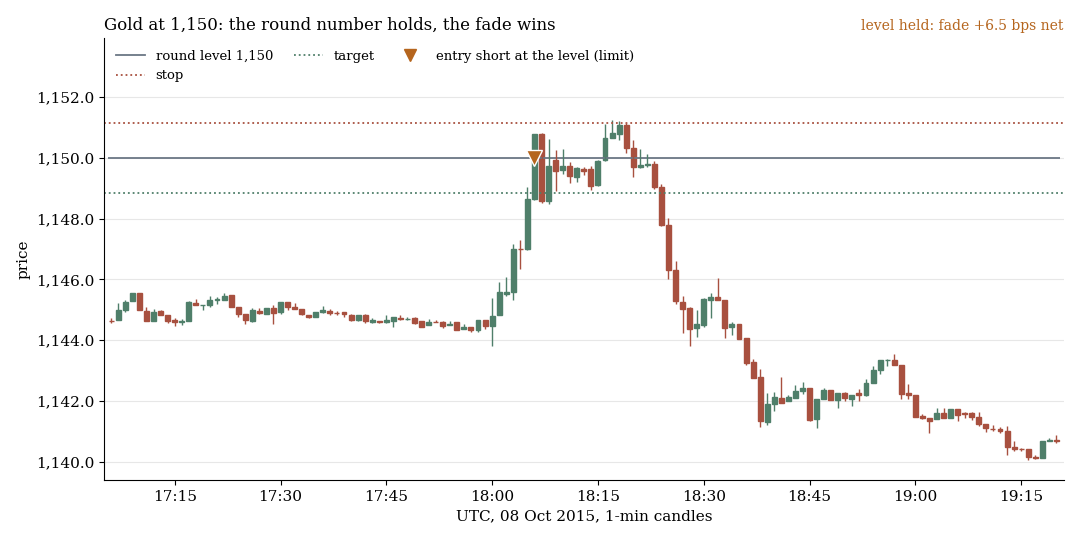
Gold, 1-minute candles, 8 October 2015 (UTC): first touch of 1,150 that day, the price bounces. The fade (short at the level, bracket ±10 bps) wins +6.5 bps net.
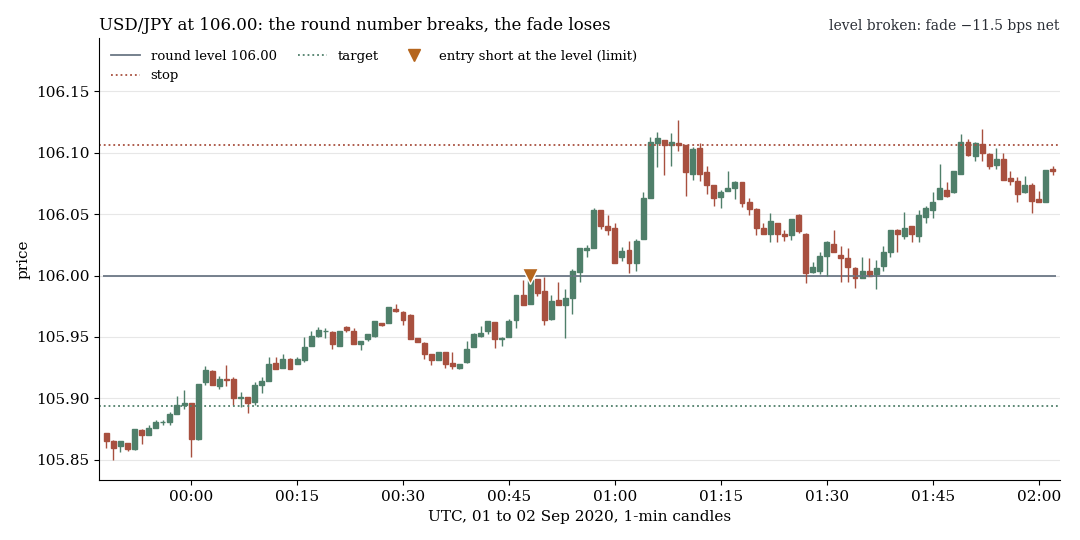
USDJPY, 2 September 2020 (UTC): first touch of 106.00, the price breaks through, the fade ends at −11.5 bps net. Both examples from the search period, drawn at random with a fixed seed.
We compared 9,474 first touches of round levels in EURUSD, GBPUSD, USDJPY and gold with 19,502 placebo touches (levels at quarter and three-quarter steps between the round numbers). The bounce is rarer at round numbers: 43.8% against 47.5% (t −5.3), in all eight years, with no difference on the random market. The second prediction holds: in the 15 minutes after the crossing, the price runs on in the crossing direction by +0.89 bps more than after placebo levels (t 4.0). A trade on that ends at −1.63 bps net (t −9.8), the fade at the level at −2.8 bps (t −28). What remains is an execution tip: do not put stops just behind a round number.
4. Combinations: filters lift the gross result, not above costs
Real effects are small. So we pre-registered eight combinations: a small real finding plus a condition from the literature or from trader rules. Two of them concern the yen fixing effect and are in the Tokyo fix study. The other six, search period 2015–2022:
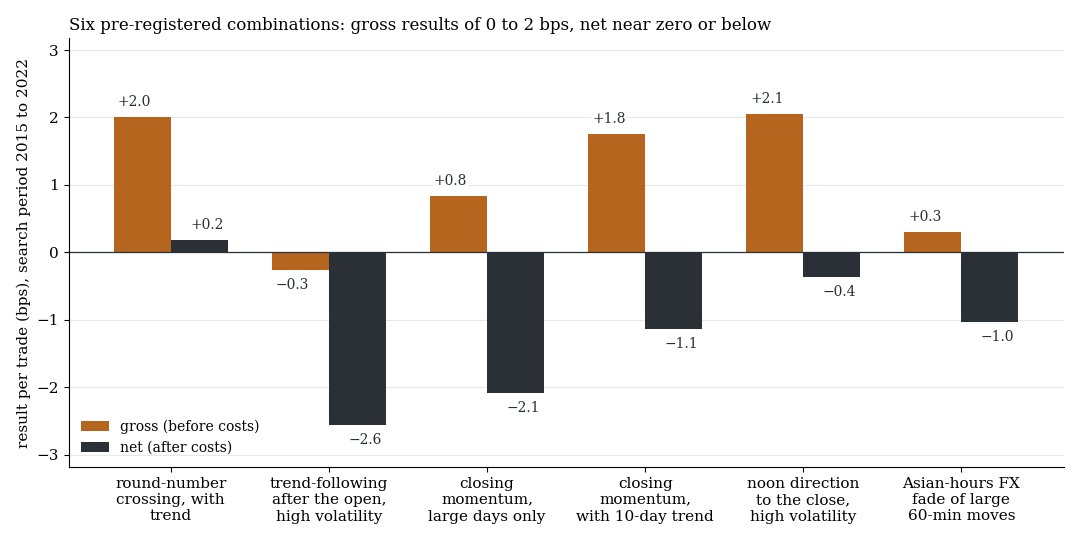
Result per trade before costs (orange) and after costs (dark).
| Combination | n | Gross (bps) | Net (bps) | t (net) |
|---|---|---|---|---|
| Round-number crossing in trend direction, 60 min | 3,443 | +2.00 | +0.18 | 0.37 |
| Trend following after the open, only at high VIX | 1,045 | −0.26 | −2.56 | −0.50 |
| Closing momentum, only on large days | 3,858 | +0.83 | −2.08 | −2.18 |
| Closing momentum, only with the 10-day trend | 6,648 | +1.76 | −1.14 | −2.02 |
| Day direction from noon to the close, only at high VIX | 6,618 | +2.05 | −0.36 | −0.25 |
| Fade of large 60-minute moves in Asian hours (EUR, GBP) | 1,101 | +0.30 | −1.03 | −2.76 |
The filters carry information in the predicted direction: closing momentum with the trend +1.76 bps gross, against the trend +0.61; at high VIX +2.05 bps, at low VIX −0.03; round numbers in trend direction +2.0 bps, at placebo levels +0.35 (descriptive, not computed as a test). Two literature conditions do not hold in our data: momentum is weaker on large days (+0.83 against +1.31 bps), trend following in stress phases is negative gross. A filter turns 1 bp into about 2 bps, while costs are 2 to 3 bps. No combination reaches net t ≥ 3.
One cell stood out: closing momentum in the DAX from 17:00 to 17:30, only with the 10-day trend. Search period: 946 trades, +2.60 bps net, t 2.89, picked afterwards from a pooled negative test (1 of 7 markets). Holdout, one run: 419 trades, +0.41 bps, t 0.65. At 1.5 times the costs it is negative, and the gain comes from 2025.
What it means
The published effects are not invented. They have become smaller, and they are smaller than the costs of a trading account. The most consistent effect of the search period (EUR/USD in the European session, positive in eight of eight years) faded over the years and was zero in the holdout, the best known (momentum in the last half hour) reversed. Anyone who wants to trade a published rule has to show that it still holds after costs and after publication. For none of the seven could we.
Limits
- CFD minute data (BID), not futures. Several papers use futures, mid quotes or order flow, so deviations are possible.
- Fixed cost model. Real costs in the closing auction and around news minutes are likely higher.
- Our translation. Some operationalisations are ours (Osler: first touch, 60 minutes, ±10 bps; Etula: intraday instead of close to close; Boyarchenko: prior-day return instead of order imbalance).
- Small samples, few holdouts. 63 FOMC dates; only three rules got a holdout (3.4 years, one draw), all other numbers come from the 2015–2022 search period and are likely optimistic. The EUR/USD holdout overlaps with another rejected window of the same series and is not independent.
- Not tested: multi-day versions, order flow, the papers' original samples. We test whether the effects exist today on these instruments.
All pattern families of the scan in the overview. Related: the ORB paper replicated, the intraday momentum paper replicated, edge persistence study.
Disclaimer: Historical statistics are no guarantee of future market behaviour. This study is not investment advice. Trading carries a risk of loss up to total loss.