Data basis: USDJPY, Dukascopy minute data in Tokyo time (JST), search period 2015–2022, holdout 2023 to 5 June 2026, plus real bid/ask ticks from a broker (Pepperstone demo feed) from April 2023 to September 2026. Calendar: Japanese business days under the national holiday law including substitute and bridge days and the bank holidays of 31 December and 1 to 3 January, checked against the official list for 2015–2026. Costs in the search period 1.6 pips per round trip; on ticks the real spread plus a flat 0.7 bps commission in the forward test. Benchmarks: non-gotobi days, Japanese holidays without a fix, a random market. No trading recommendation.
Every business day at 09:55 Tokyo time, Japanese banks set the rate at which they settle foreign exchange with their corporate clients. Importers and institutions that need dollars buy through this fix. On the so-called gotobi days, the 5th, 10th, 15th, 20th, 25th and the last day of the month, when many invoices fall due in Japan, the demand is largest. This is documented in the literature (Ito and Yamada, 2017) and it has a clear counterparty: companies that must buy at a fixed moment.
Next to the index event days, this is the only trace in our scan that points the same way in both data sources and in every control. But it is small, and small is not enough for proof. So we froze the rules and are testing them forward.
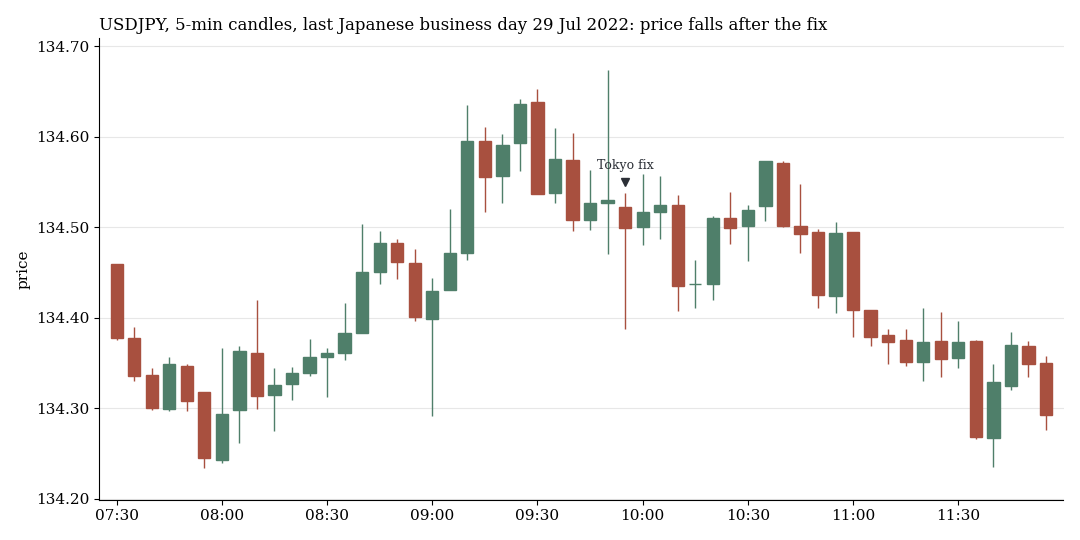
USDJPY, 5-minute candles on the last Japanese business day of July 2022. The marker shows the fix at 09:55. After it the dollar gives way. Both example days were drawn at random from all month-end days of the search period (fixed seed): one with a falling path after the fix, one with a rising path.
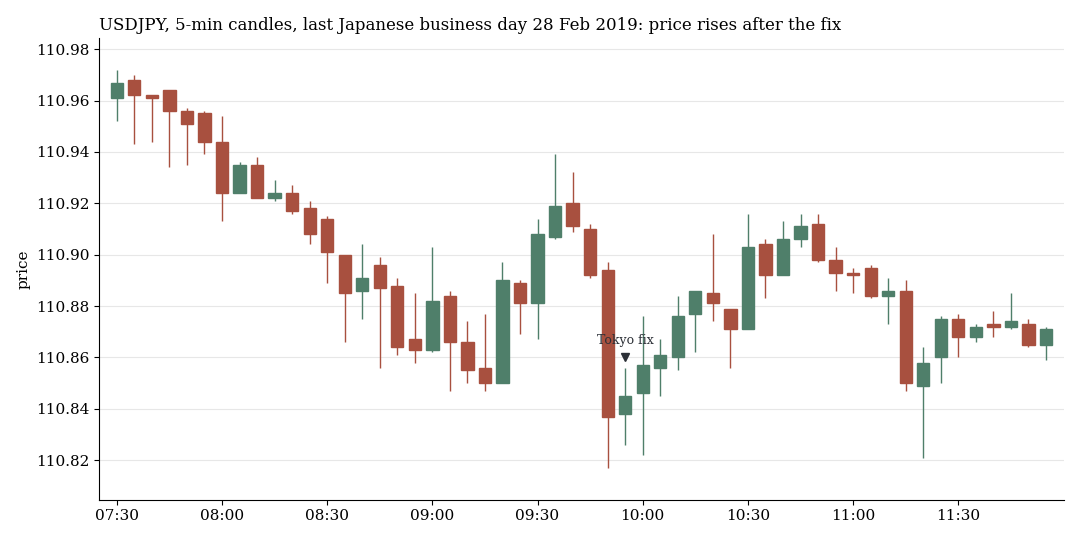
The counterexample from 28 February 2019: here USDJPY kept rising after the fix. The effect is a tendency over many days. On single days, news and other flows dominate.
1. The trace in the data
In the 2015–2022 search period USDJPY rises on every Japanese business day by an average of 1.43 basis points in the half hour before the fix (t 6.7) and falls by 1.35 basis points in the half hour after it (t 6.4). On gotobi days the rise is about twice as large and starts earlier: over the two hours before the fix it is +2.74 basis points, against +0.23 on the other days.
The most important control is Japanese holidays that fall on weekdays. There is no fix then, but the rest of the world trades normally. If the effect were only a property of the clock, it would show up on those days too. It does not; it reverses. In the two hours before 09:55 USDJPY falls on holidays by 4.28 basis points on average (t −2.9, n 112). The effect belongs to the fix, not to the clock.
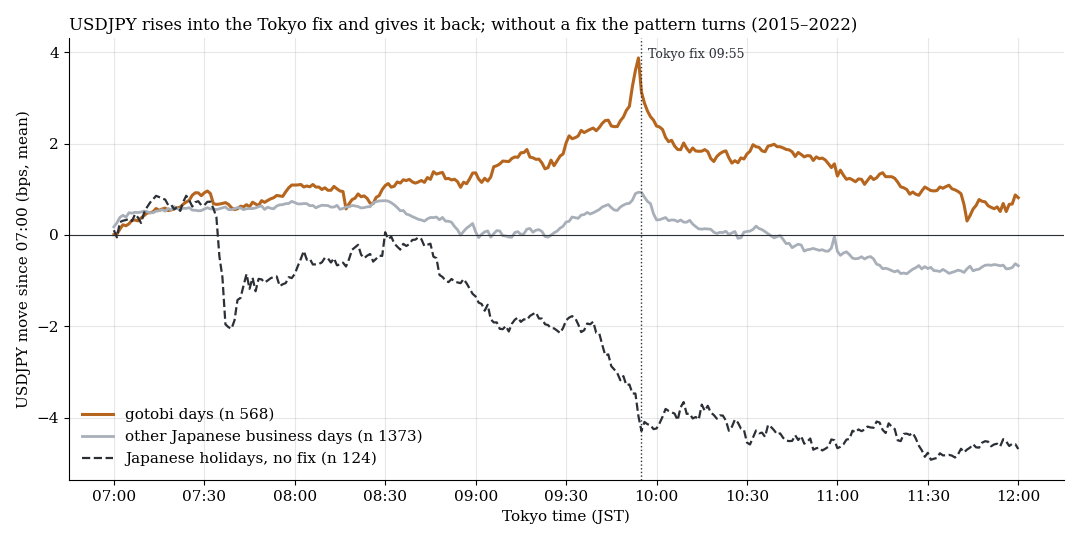
Average USDJPY path from 07:00 Tokyo time, search period 2015–2022, gross. Orange: gotobi days. Grey: other business days. Dashed: Japanese holidays without a fix. The rise into the fix, the decline after it and the reversed picture on holidays are easy to see. The curve is descriptive, not a trading result.
Gross, this is highly significant. Net, little is left. After 1.6 pips of round-trip costs nothing remains on ordinary business days, and gotobi days reach a t of about 2. Only the month-end stayed clear net of costs (t 4.9). On the random market with identical code nothing comparable appeared: 8 of 248 variants with |t| > 2 where about 12 are expected, against 83 on the real data.
2. Three rules, three day types
From the trace we derived three simple rules, each with a fixed direction and fixed times:
- Month-end: short from the fix until late morning.
- Gotobi days: long into the fix, then short until late morning.
- Japanese holidays on weekdays: short in the morning until the time the fix would otherwise be.
On real broker ticks, meaning real bid and ask instead of minute data and a cost assumption, the rules looked like this:
| Rule | Search period 2015–2022 | Real ticks 04/2023 to 06/2026 | New since 6 Jun 2026 |
|---|---|---|---|
| Month-end | n 96, +4.35 bps, t 4.9, 8 of 8 years | n 38, +5.1 bps, t 1.8 | n 3, +9.4 bps |
| Gotobi days | n 573, +3.35 bps, t 3.0 | n 225, +4.5 bps, t 2.7 | n 22, +5.3 bps, t 1.0 |
| Holidays | n 126, +1.7 bps, t 1.3 | n 56, +5.6 bps, t 3.3 (to 09/2026) | n 5, +6.4 bps |
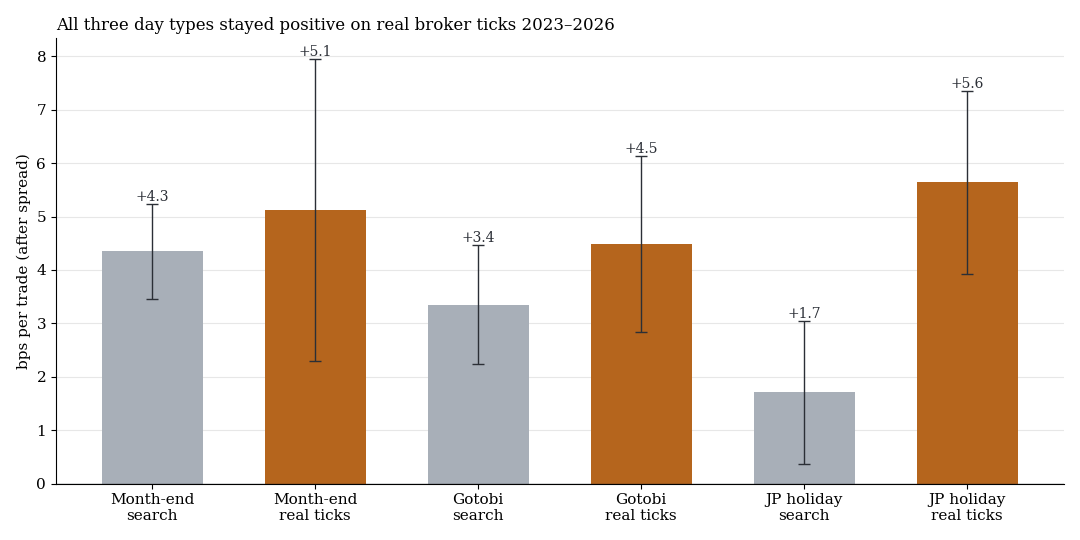
Result per trade after spread, with one standard error. Grey: search period (minute data, 1.6 pips costs). Orange: real broker ticks 2023–2026, before commission.
Costs are lower than assumed. On real ticks the spread around 09:55 had a median of 0.3 pips on every day type. Even the average peak in the fix minute at month-end was 0.88 pips. The 1.6 pips of the search period were conservative. Delay at entry hurts the month-end rule little: with 5, 30 or 60 seconds of latency it kept +4.1 to +4.5 bps.
3. Why this is not proof
Three reasons argue against drawing conclusions too early.
The global correction. Across the whole scan, 19 candidates ran through the holdout once each. Corrected over all of them, the month-end rule sits at q = 0.15 and the gotobi rule at q = 0.13. Passed locally, not globally. The only globally confirmed finding is described in the study on index event days.
The month-end rule depends on a few months. Without its five best months, its holdout t drops to 0.6. The effect sits mostly at quarter ends. We only saw that after looking at the data and did not turn it into a rule of its own.
The gotobi rule lives on the exact switch. The switch from long to short has to happen at the fix. One minute later the result on real ticks shrinks from +4.5 to +1.9 bps. Whoever does not trade to the minute trades a different rule.
Then there is the holiday rule. Its direction was already in the search report, but we only wrote it down as a rule after the 2023–2026 values were known. For this rule the forward test is the first clean test at all.
And the size: 3 to 5 basis points per trade, about 12 month-ends and roughly 70 gotobi days a year. Even if everything holds, this is a small building block. Hougaard-style trade management does not help either; in the search period it lowered the month-end rule from 4.35 to 2.79 bps.
4. The pre-registration
On Sunday, 27 September 2026, before the next event day, we froze the three rules in writing. Nothing about them has changed since. Only what happens afterwards counts.
| Item | Setting |
|---|---|
| Data | real bid/ask ticks, price = first tick from the target second |
| Costs | real spread in the prices plus a flat 0.7 bps commission per round trip |
| Evaluation | 30 September 2027, interim looks allowed, no rule changes |
| Pass | net mean > 0 and t ≥ 1.65, Holm correction over three rules (p < 0.017 / 0.025 / 0.05) |
| Expected cases | month-end 12, gotobi about 70, holidays about 15 |
The exact times are in the pre-registration document. We will publish it with the evaluation. So that nobody has to assume we adjust it afterwards, here is its SHA-256 checksum. Any change to the document would change it:
8833eea12aab6c1a961f1833fde2b3c88438979b0af43324643d919278cc21fc
Failing after twelve months would mean "not shown", not necessarily "no effect". For the month-end and the holiday rules the number of cases is only enough if the effect is large.
5. What it means
This is the pattern a real edge leaves in our data: a mechanism with a counterparty, a trace that points the same way in every control, and a result that is barely larger than the costs. Directional patterns without a mechanism did not leave this trace anywhere in the scan.
Until the evaluation, only the forward test counts. We will report the result here in October 2027, including if it is negative.
All pattern families of the scan in the overview. The other fixings without an edge (London, gold, bitcoin, yuan, ECB) are in the fixings study, the Japanese fiscal year-end in the study on further forced flows. Related: the month-end effect.
6. Limits
- Demo feed. The real ticks come from a broker's demo feed. Earlier comparisons found it close to live, but a live account can still fill differently.
- Commission depends on the account. The 0.7 bps in the forward test are a flat assumption. Other accounts pay more or less.
- Calendar. The holiday calendar follows the law and was checked against the official list for 2015–2026. Future special holidays are missing until they are enacted.
- Interventions. On days when the Japanese Ministry of Finance intervenes, USDJPY moves many times the size of the effect. Such days are in the data and are not filtered out.
- Overlap. The days up to 5 June 2026 were already used once in the holdout. The tick evaluation on them checks costs, not the edge. New evidence starts with the forward test.
- Not tested: other yen pairs, futures, the time after noon, days with a changed fix time.
Disclaimer: Historical statistics are no guarantee of future market behaviour. This study is not investment advice. Trading carries a risk of loss up to total loss.