Data basis: FTSE 100 (index CFD), Dukascopy minute data in London time. Event days = trading day of the closing auction before the effective date of the quarterly FTSE 100 and STOXX reviews (third Friday of March, June, September, December) and of the MSCI index reviews (dates from MSCI press releases). Search period 2015–2022 (63 event days), physically separate holdout January 2023 to 5 June 2026 (27 event days), exactly one run. Costs 1.5 index points per round trip. Benchmarks: placebo days (same weekday two weeks before and after, no event), a random market, the same rule on seven other index markets. Real broker ticks (Pepperstone demo feed) for 25 holdout event days. No trading recommendation.
Index funds have to track their index, and they track it at the close. When the composition changes, they therefore trade the change in the closing auction before the effective date. On that evening the deleted stocks are still in the index and are sold into the auction, while the new stocks are not in yet. If that pressure shows up in the index level, the index should fall into the auction print on event days.
This is not a chart pattern. It is a mechanism with a counterparty that has to trade. We tested flows like this after the large pattern scan, because directional patterns on minute data came out at zero after costs across the board. The test followed a fixed recipe: name the counterparty, write the prediction down in advance, check that the effect scales with the flow, measure against placebo days and a random market, then exactly one holdout run, then real ticks.
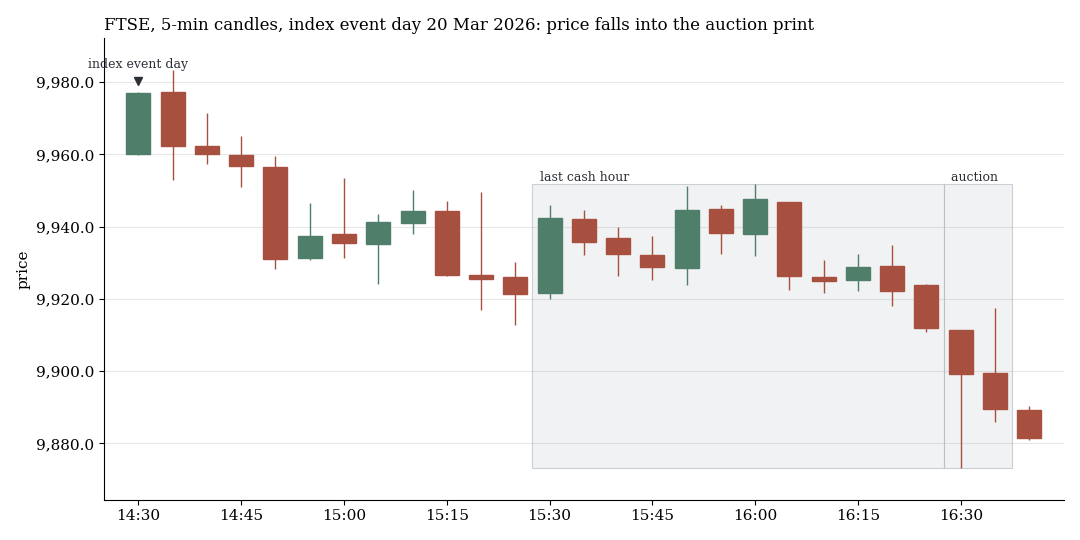
FTSE, 5-minute candles on the event day of 20 March 2026. Shaded: the last cash hour and the auction window. The price gives way in the final minutes and takes its largest step with the print. Both example days on this page were drawn at random from the 27 holdout event days (fixed seed): one with a falling path, one with a rising path.
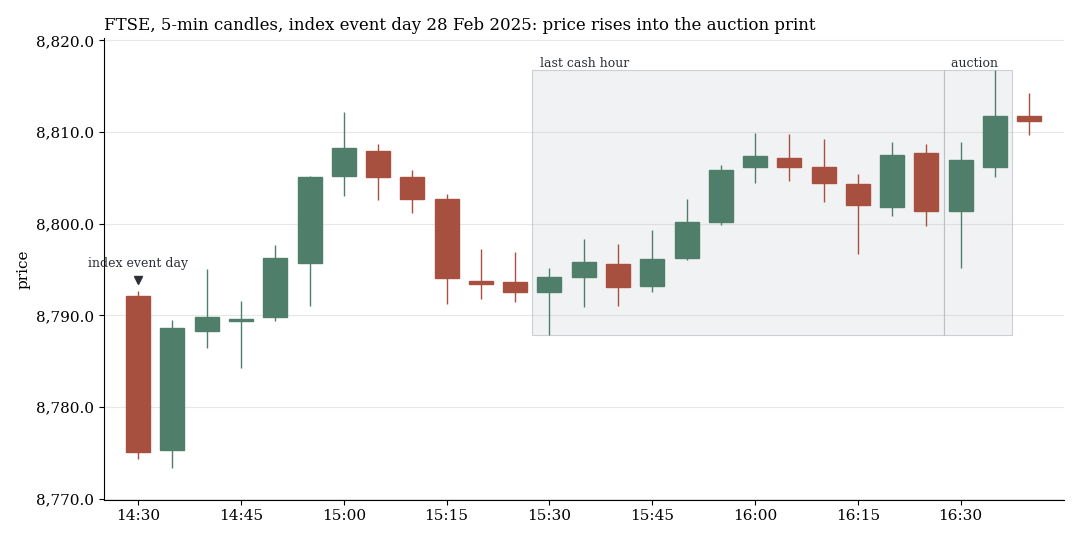
The counterexample from 28 February 2025: on this MSCI event day the FTSE rose into the auction. The effect is a tendency across many days, not a promise for any single day. In the holdout, 5 of 27 event days were negative.
1. The flow is visible in the CFD
Before testing any direction, we asked the simpler question: can the flow be seen at all? The range of the candles in the auction window was wider on event days than on placebo days in all eight index markets we examined, 1.2 to 1.7 times as wide depending on the market. In the FTSE the ratio was 1.42 (t 8.5). The futures-roll control days showed nothing. The flow is real, and it arrives where it should: in the auction.
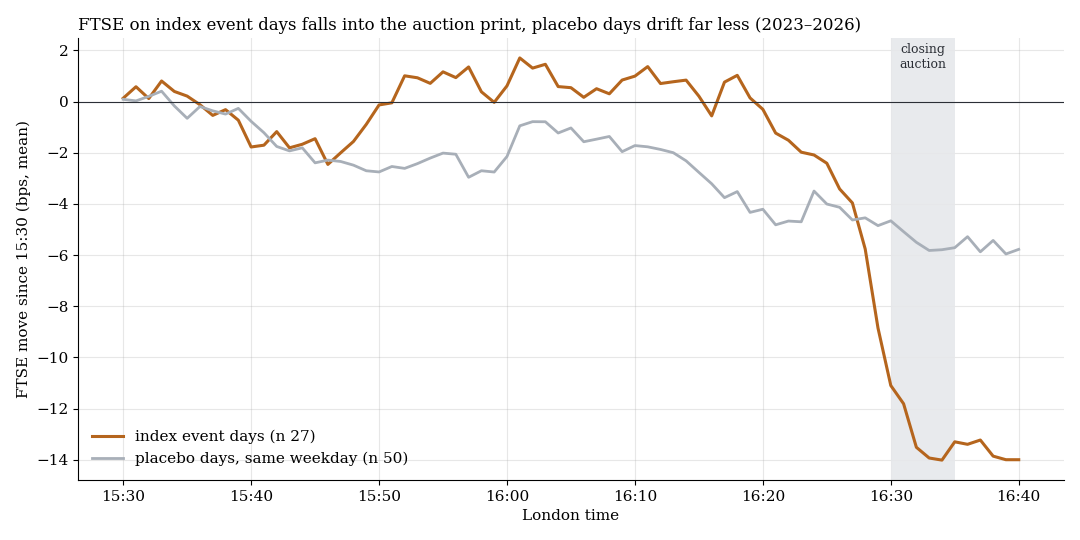
Average FTSE path from 15:30 London time in the 2023–2026 holdout, gross. Orange: the 27 event days; grey: 50 placebo days on the same weekday. Until about 16:20 there is no selling pressure on event days. After that the index falls by more than 10 basis points, most of it with the auction print. The curve is descriptive, not a trading result.
2. The direction: short until after the print
The rule is as simple as the mechanism: on event days, sell in the last cash hour and buy back after the auction print. The entry time is not critical. In the holdout, entries 15 to 60 minutes before the close made between +9.9 and +12.3 bps.
| Sample | n | net per event day | t | positive days | positive years |
|---|---|---|---|---|---|
| Search period 2015–2022 | 63 | +8.3 bps | 2.3 | 65% | 8/8 |
| Holdout 2023 to June 2026 | 27 | +11.5 bps | 3.9 | 81% | 4/4 |
| Holdout, real broker ticks (bid/ask) | 25 | +11.9 bps | 4.2 | 80% | n/a |
| Placebo days in the holdout | 51 | +0.05 bps | 0.0 | n/a | n/a |
The holdout came out larger than the search period, not smaller, which is what almost always happens to chance findings. It also survives the usual stress tests:
| Check (holdout) | net per event day |
|---|---|
| costs × 1.5 / × 2 | +10.6 bps (t 3.9) / +9.7 bps (t 3.6) |
| entry 1 / 2 minutes later | +12.2 / +13.1 bps |
| without the five best days | +6.4 bps (t 3.2) |
| MSCI event days only / FTSE 100 and STOXX only | +12.0 bps (n 14) / +11.0 bps (n 13) |
| years 2023 / 2024 / 2025 / 2026 | +11.5 / +13.7 / +2.7 / +28.9 bps |
The broker spread does not widen on event days: 1.0 points before the cash close, 1.8 points after it, on event days and placebo days alike. The assumed costs of 1.5 points are therefore realistic.
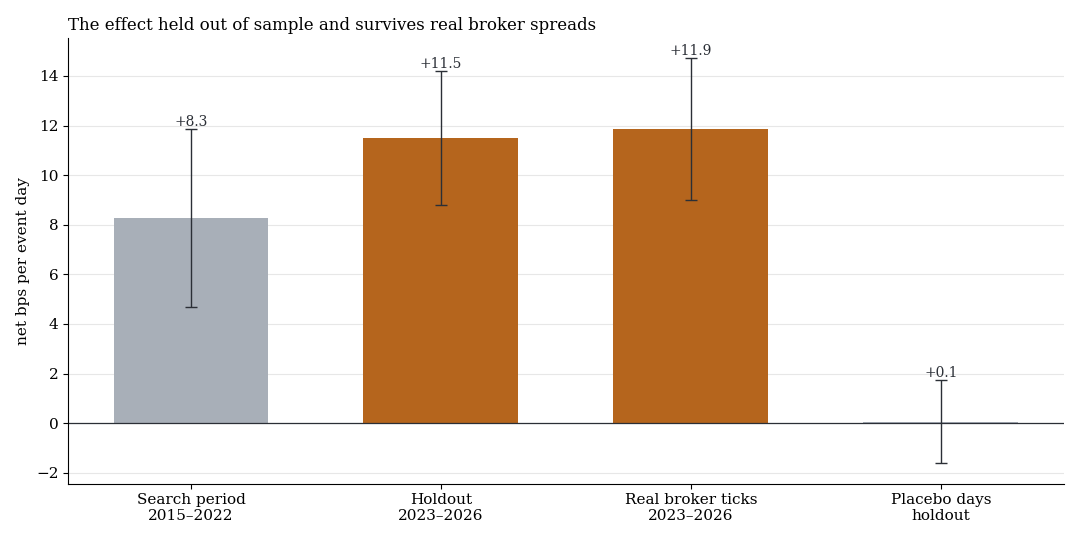
Net per event day with one standard error. The holdout sits above the search period, real broker ticks confirm it, placebo days sit at zero.
What decides it is the multiple-testing correction. Across the whole scan, 19 candidates each ran through the holdout once. Corrected over all 19 (Benjamini-Hochberg), this finding is the only one confirmed, with q = 0.0008. All others sit at q ≥ 0.13.
3. Two thirds arrive with the print
Exiting before the auction captures only part of it. With the exit one minute before the cash close the holdout made +4.0 bps (t 2.1), with the exit after the print +11.5 bps. At its core the rule is a bet on the auction price, not on the way there.
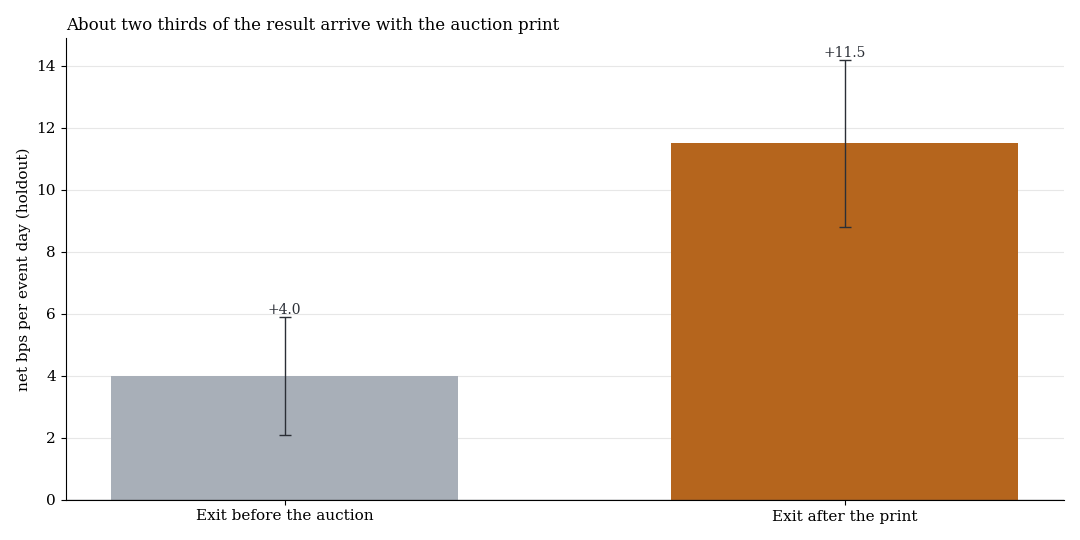
Holdout 2023–2026, net per event day. About two thirds of the result only arrive with the auction print.
That has a practical consequence. You need a venue whose price reflects the print. Our broker's CFD does: the tick data show the jump after 16:30 and almost the same values as the minute data day by day (for example 20 March 2026: +35.3 bps in both sources, 29 May 2026: +45.0 against +44.5 bps). How well an order fills in the second of the print cannot be judged from historical ticks.
4. Why we remain cautious: the twin in Sydney
The stronger lead in the search period was not London but Sydney. The Australian index showed the same rule at +12.6 bps per event day (t 3.4, 7 of 8 years positive). In the holdout it lost 3.5 bps per event day, 3.3 bps on real ticks. The search report had hinted at it: 81% of the total came from 2020 and 2021.
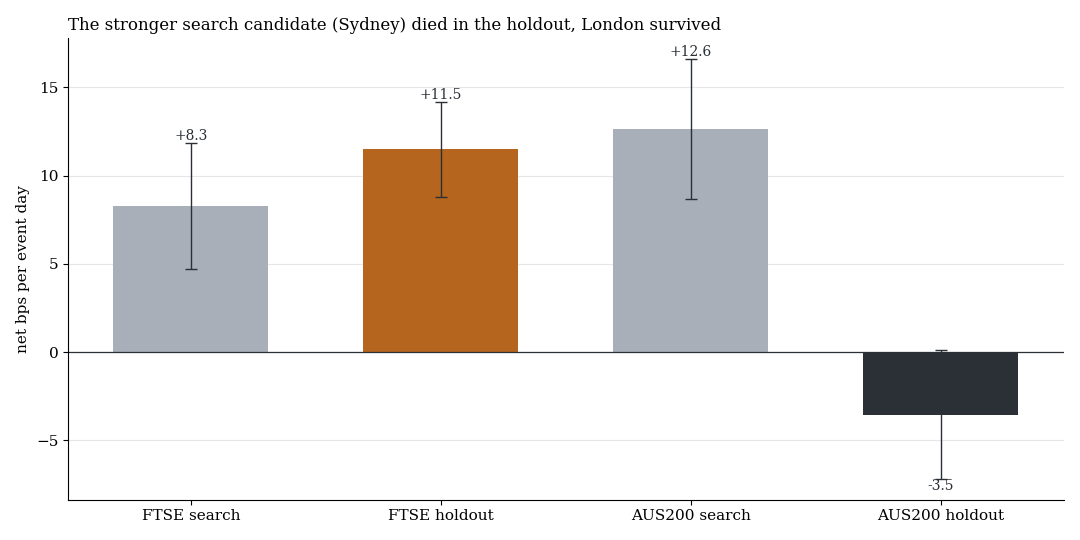
The better candidate of the search period died in the holdout, the weaker one survived. That is exactly the pattern you could also see with two random draws from eight markets.
In the search period the FTSE was only an observation (t 2.3) and was picked after looking at eight markets. The holdout is untouched by that choice and is therefore the actual test. The selection still raises the chance that London is a lucky draw too. A third variant (trading with the direction of the day into the auction) also looked good in the search period. The independent re-implementation found a programming error in it: the direction was set with a price from 30 minutes after the entry. Corrected, nothing was left.
5. What it means
The edge with a counterparty exists, but it looks nothing like the promises online. About eight event days a year with an expectation of about 10 basis points add up to roughly 0.8% a year on the notional employed. That is a building block, not a business model. In return the mechanism has capacity: the pressure comes from billions in passive funds and does not disappear because a few private accounts join in.
From the next event days (MSCI on 30 November 2026, FTSE 100 and STOXX on 18 December 2026) the rule continues as a forward test with real fills. The measurement on this page is fully described. We do not publish the execution parameters of our own implementation (exact entry minute, protection, position size).
All pattern families of the scan in the overview. Why we check every calculation chain on a random market first is explained in the study on the random market as a ruler. Related: the month-end effect and after the EU close.
6. Limits
- 27 holdout days are one draw, not a proof. Two days in 2026 (+35 and +45 bps) carry 30% of the holdout total. Without the five best days, +6.4 bps (t 3.2) remain.
- Selection after looking. Market and direction were chosen in the search period out of eight markets. The global correction covers the holdout tests, not this preselection.
- Execution at the print. After the cash close the CFD quotes a 1.8 point spread instead of 1.0. How well an order fills in the second of the print is open. Commissions are not included. The ticks come from a demo feed.
- Calendar. FTSE 100 and STOXX dates follow the published rule (third Friday), MSCI dates the press releases. UK bank holidays have no auction, for example the MSCI date of 31 August 2026.
- Not tested: futures instead of CFDs, single stocks, other brokers' pricing after the cash close, event days outside the eight index markets we examined.
- Since the end of the holdout there were two more event days with ticks: −8.7 and +13.3 bps.
Disclaimer: Historical statistics are no guarantee of future market behaviour. This study is not investment advice. Trading carries a risk of loss up to total loss.