Data basis: SPX, Dow, NQ, DAX, FTSE (vol-control) and USDJPY (fiscal year-end, with EURUSD and GBPUSD as controls); Dukascopy CFD minute data (BID). Search period 2015–2022. For the fiscal year-end the holdout 2023 to 5 Jun 2026 is added (a single run); for vol-control it stayed untouched because no test produced a candidate. The vol-control signals come from official daily closes up to the previous day. Costs per round trip: SPX 0.8, Nasdaq 2.5, Dow 4.0, DAX 2.5, FTSE 1.5 points; USDJPY 0.016 yen per leg (two legs about 2.9 bps). Benchmarks: random markets, calm days and other month-ends as placebo, placebo windows. No trading recommendation.
We tested two more forced flows with the same recipe (direction in advance, dependence on size, placebo, random market): volatility-target funds and the Japanese fiscal year-end.
Vol-control funds hold equities in proportion to target volatility over realised volatility. After a big day realised vol rises, so they must cut exposure whether the day was red or green, usually into the close of the next day. The last trading hour should then be negative after shock days, the more so the bigger the shock.
Japanese exporters, life insurers and pension funds close their books on 31 March and 30 September. Dollar proceeds and balance-sheet hedges are settled by then, part of it through the Tokyo fix. On these days the fix pattern should be bigger than on ordinary month-ends. The fix itself is covered by the Tokyo study.
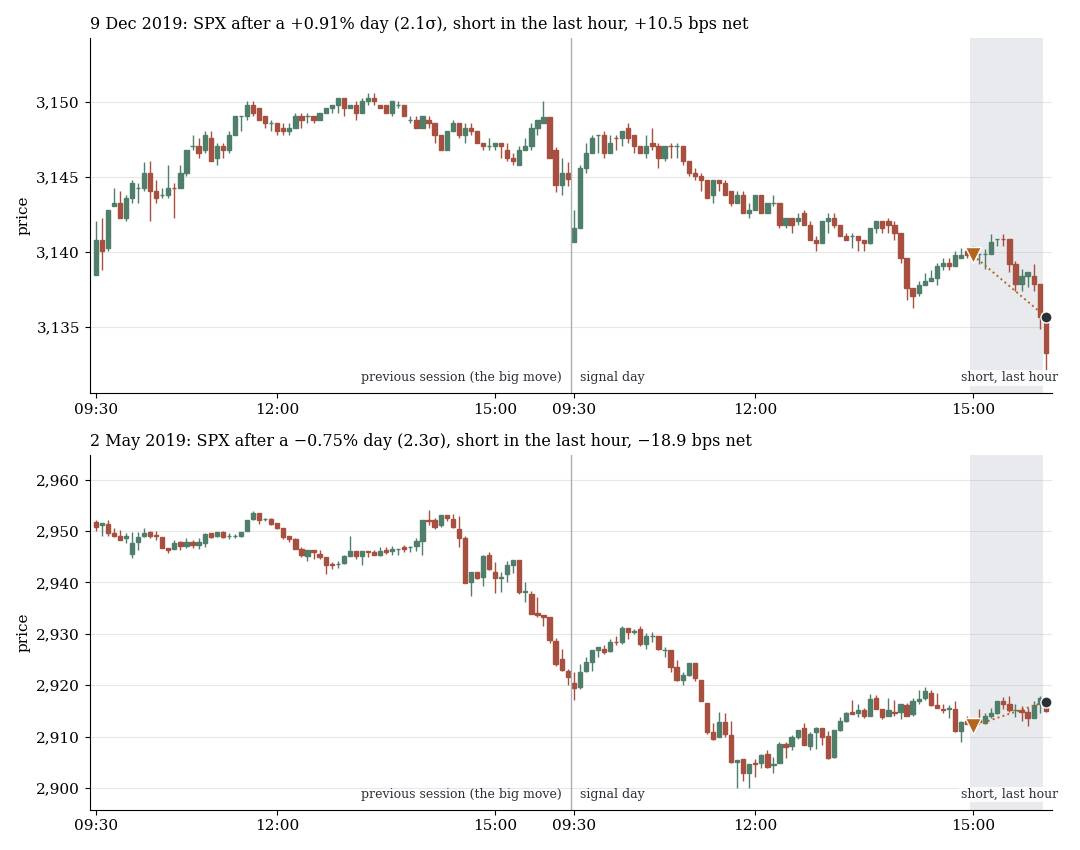
S&P 500, 5-minute candles, previous day and signal day, short in the last hour: first positive (top) and first negative example (bottom), drawn at random (fixed seed), 2015–2022.
1. Vol-control: the last hour after shock days
A jump is a daily return of more than two standard deviations (20 trading days up to the day before yesterday). On the next day we short the last trading hour. Set in advance: the effect grows with the size of the jump and holds after up days and down days alike.
| Market | n | Gross (bps) | Net (bps) | t | Hit rate |
|---|---|---|---|---|---|
| Dow | 131 | −4.21 | −5.87 | −0.98 | 52% |
| Nasdaq (NQ) | 131 | −3.55 | −7.04 | −1.17 | 50% |
| S&P 500 (SPX) | 132 | −1.15 | −4.00 | −0.65 | 52% |
The short loses even before costs: after such days the last hour rises slightly on average. Bigger shocks do not help.
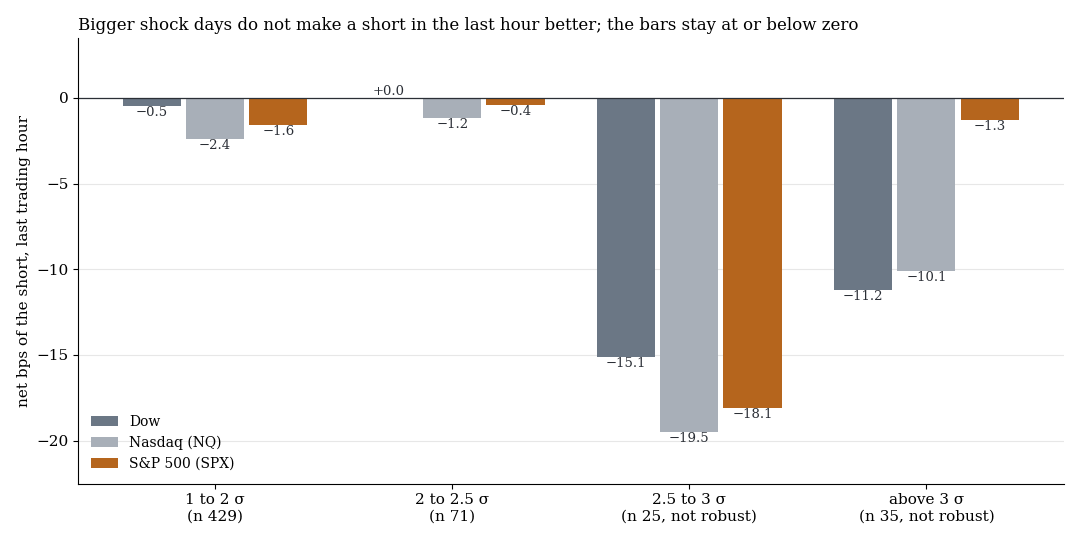
Net result of a short in the last trading hour after jumps of different size (multiples of the standard deviation), 2015–2022.
After up days (n 56) the net result is zero (Dow +1.5, Nasdaq +0.1, SPX −0.3 bps), after down days (n 75) it is −6.7 to −12.3 bps, against the short. A vol-control sale would have to show after both signs. For the short, jump days are even worse than calm days (difference −3.8, −3.3 and −0.9 bps). Random markets with the same rule and the same signal days land in the same range (SPX −1.5 and −7.1 bps). The mirror, long after a strong drop in volatility, earns about +1 bps gross in every third: the known small closing drift, independent of the vol regime.
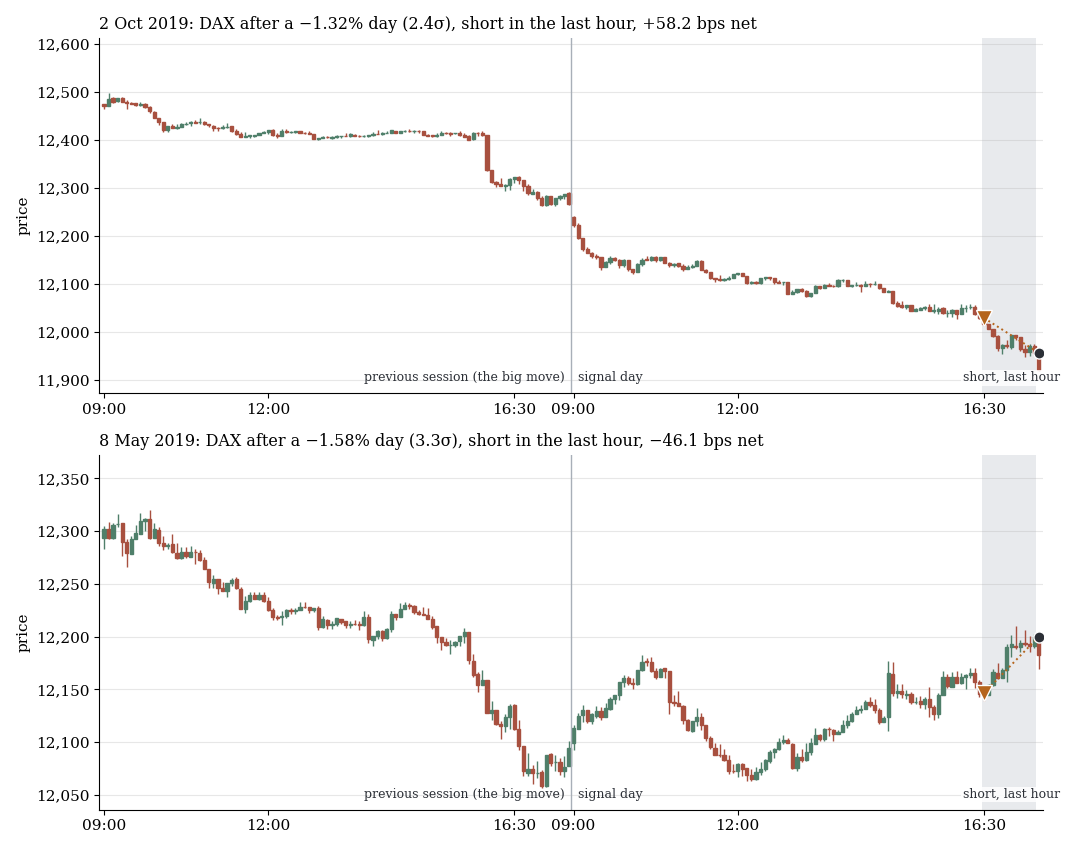
DAX, same rule: first positive (top) and first negative example (bottom), drawn at random, 2015–2022.
In the DAX (n 151) and the FTSE (n 140) nothing remains after jumps (net −0.3 bps, t −0.1, and −4.0 bps, t −1.2). The DAX shows −5.8 bps after up days and +3.9 after down days, the reverse of the US indices. Of 383 variants, 36 pass the multiple-test correction, all in the drift and placebo family with negative net, i.e. costs. The core family has no hit (smallest q 0.11).
2. Japanese fiscal year-end
We tested the last three Japanese business days of March and September (48 days in the search period) against the same calendar position in the other months (240 days). The rule is a round trip around the Tokyo fix in USDJPY: one leg before the fix and a short leg after the fix until late morning, with the costs of both legs deducted.
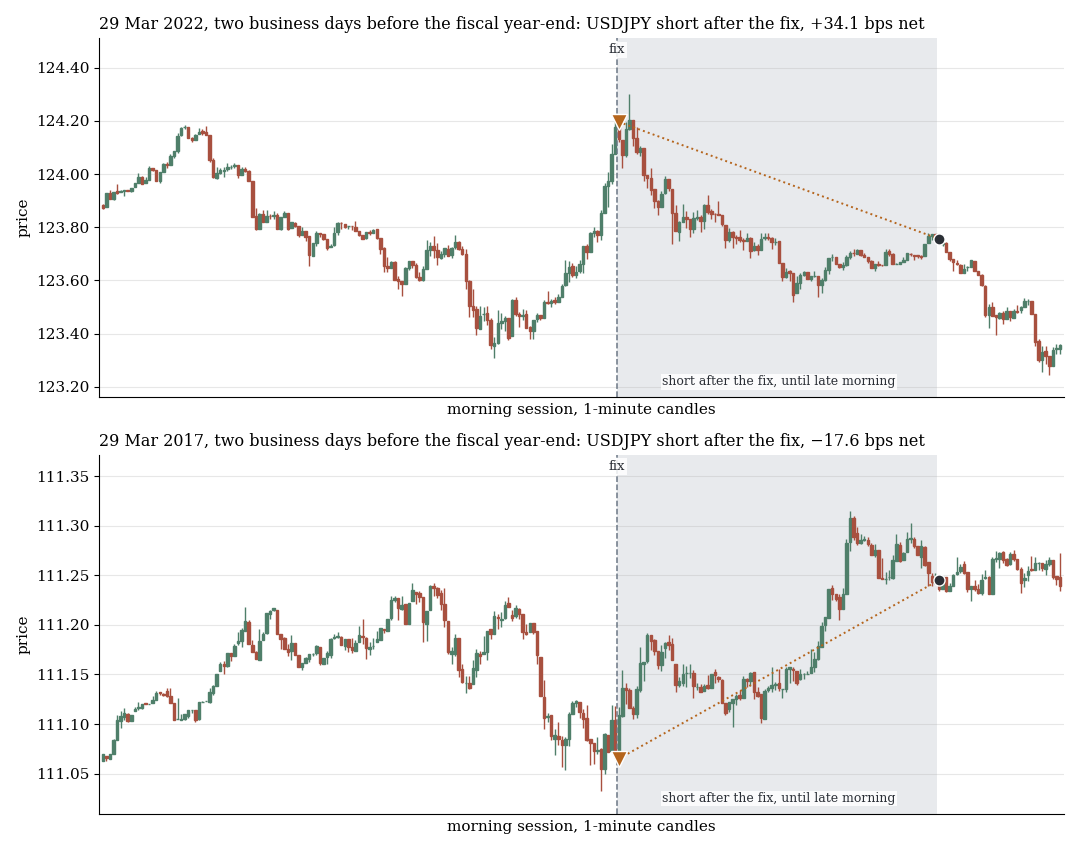
USDJPY, minute candles, short leg after the fix on the last three business days of March and September: first positive (top) and first negative example (bottom), drawn at random, 2015–2022.
| Round trip, net | n | bps per day | t |
|---|---|---|---|
| Search period, year-end days | 48 | +6.25 | 1.97 |
| Search period, other month-ends | 240 | −0.79 | −0.57 |
| Holdout, year-end days | 21 | +6.66 | 1.40 |
| Holdout, other month-ends | 102 | +0.09 | 0.04 |
The direction holds, and so does the size. But the holdout misses the 0.05 threshold with p 0.081, and after the global multiple-test correction across all holdout tests q is 0.29. Costs are not the problem, the statistics are. Four findings argue against a fix amplifier.
The ranking breaks. Expected: March above September above quarter-ends above other months. In the search period it held (+10.87, +1.63, −0.78, −0.79 bps), but only thanks to March (n 24). In the holdout the quarter-ends of June and December lead (+11.50), March sits at only +6.07.
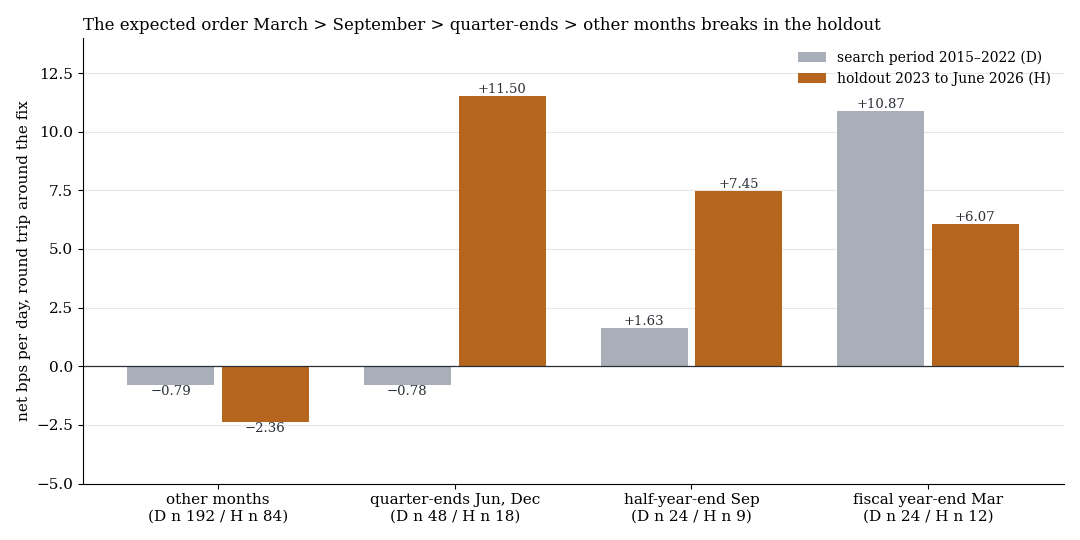
Net result of the round trip by type of month-end, search period (grey, D) and holdout (orange, H). Other months exclude the quarter-ends, n per group in the axis label.
A few days carry everything. Without the five best days, +1.24 bps (t 0.59) remain in the search period and −4.26 bps (t −1.50) in the holdout. The five days are 83% and 151% of the sum.
A window without the fix shows the same. The same days beat the other month-ends in a window without the fix by +6.05 bps (t 0.76) in the holdout, in the fix window by +6.57 (t 1.05). That is a day effect, not a fix effect.
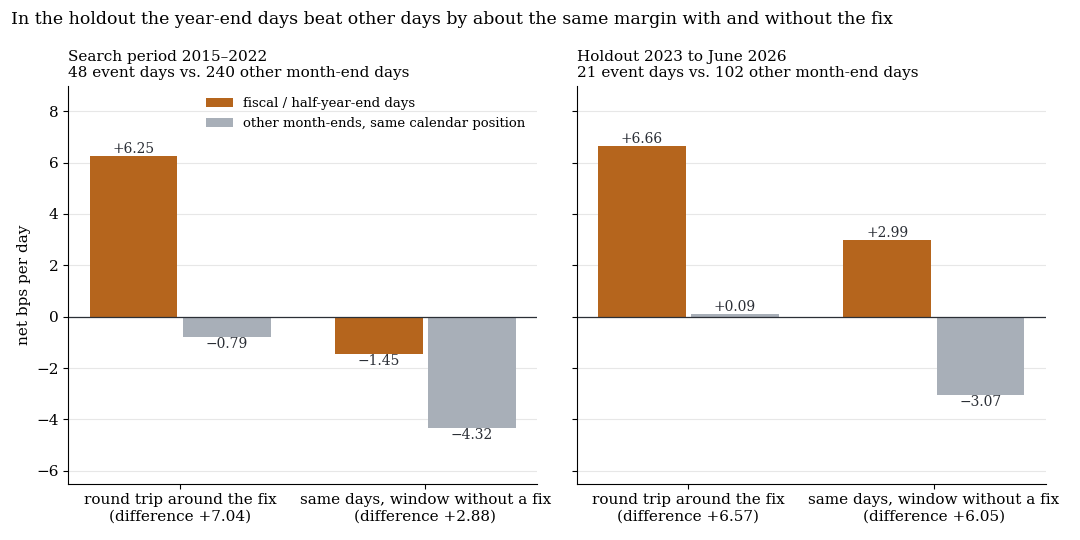
Round trip around the fix and the same pattern in a window without the fix, year-end days against other month-ends, net bps per day. Left: search period, right: holdout.
The random market catches up. With identical code, two random markets produce differences of −4.70 and +3.75 bps. The real value +7.04 (Welch t 2.02) sits at the edge, not outside.
Days 5 to 3 before the year-end show nothing (round trip +0.24 bps, t 0.08). In EURUSD and GBPUSD the round-trip difference is indistinguishable from zero (+1.5 and −1.6 bps). Some of the days overlap with the Tokyo fix pattern, so this is not an independent second confirmation.
What it means
Both mechanisms are plausible; neither shows up in prices as a tradable reaction. For vol-control the flow is either small against the volume of the last hour or spread over days and times of day; we did not test which. At the fiscal year-end the direction is right and in the holdout so is the size. But 21 days support no conclusion (standard error 4.6 bps), the ranking breaks, and a window without the fix wins just as much. The year-end gain is therefore a day effect rather than a fix effect. For the Tokyo fix itself this study adds no support.
Limits
- CFD minute data (BID), fixed costs. The spread spike at the close is not modelled and would only make vol-control worse.
- One vol-control parametrisation. 20-day sigma, 2-sigma threshold, thirds of the 5-day change in vol. Not tested: exponentially weighted vol, weekly rebalancing, target-vol bands, rebalancing already at the previous close. The signals come from daily index closes, not from the CFD.
- Small cells. Cells with n below 100 (above 2.5 sigma, VIX jump above 20%) are not robust, and the jump days cluster in 2015/16, 2018, 2020 and 2022.
- Vol-control in the search period only. No candidate, no holdout.
- Fiscal year-end: 48 days in the search period, 21 in the holdout, 16 per single day. Calendar built from rules, costs fixed. Not tested: brackets, other exit times, JPN225, 1 April, the bonus season. Of 82 variants three pass the multiple-test correction: one belongs to the Tokyo fix pattern, two are single-day cells with n 16.
All pattern families of the scan in the overview. Related: the month-end effect, the Dow calendar and the index rebalancing dates.
Disclaimer: Historical statistics are no guarantee of future market behaviour. This study is not investment advice. Trading carries a risk of loss up to total loss.