
Note, 29 September 2026: Part of the R values in this study comes from our older backtest chain, which also books positive R on a random market without direction. Those values are too high; results that do not depend on the chain (price statistics, counts) are unaffected. Details: The random market as a ruler.
Re-run, 5 October 2026: The 25 combinations of breakout rule and market from our rulebook have been re-measured on the corrected chain and on real broker ticks. None has an advantage over the random market; after costs the mean is −0.08 R per trade. The affected R values in this study are therefore not proven, the other results are untouched. All numbers: Our own breakout rules, re-measured.
Data basis: Dow and NQ, US cash session 09:30–16:00 New York, 02 Feb 2015 – 05 Jun 2026, 2,924 trading days per index on M1 data, all daily metrics normalised by ATR20 (previous day's ATR, lookahead-free). Setup level: our episode base, 41,835 trades (Dow 20,804, NQ 21,031), exit trailing stop BE 0.5 / TS 1.0 / step 0.5, net of spread and slippage, standard errors clustered by day. Index weights: as of August 2026. No trading recommendation.
Anyone trading Dow and NQ side by side easily treats them as two variants of the same instrument: both US equity indices, same session, same headlines.
We measured two levels that argue against it. The first is pure arithmetic — how the index is built. The second is empirical — whether that construction shows up in which calendar dates the two indices react to, and whether "reacting" means the same thing at the daily level as it does at the setup level.
1. The Dow is price-weighted, not cap-weighted
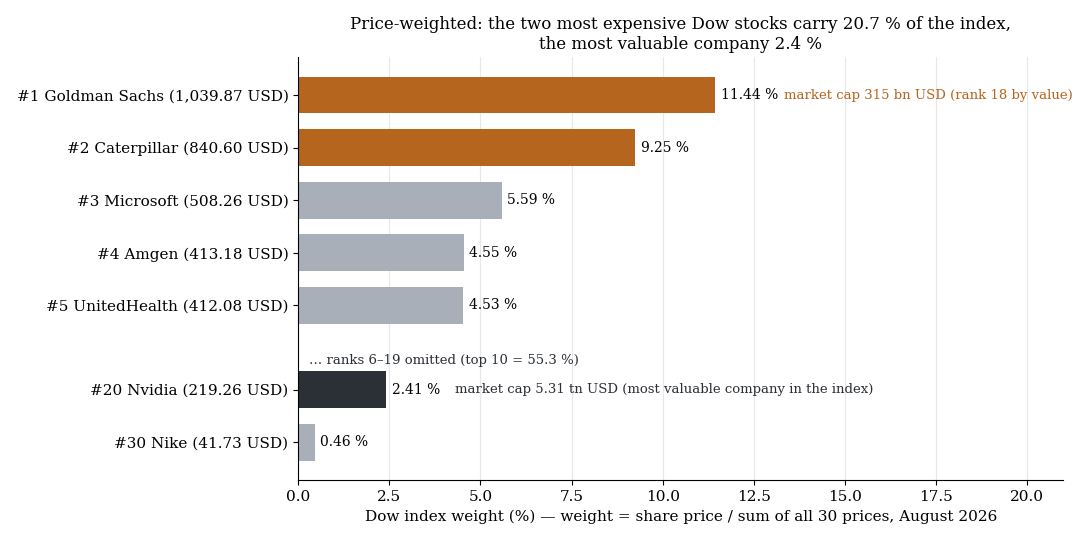
Price weighting: the two most expensive Dow stocks carry 20.7 % of the index, the most valuable company 2.4 %.
In the NQ or the S&P 500, market value determines a stock's weight. In the Dow, the share price does: weight = price divided by the sum of all 30 prices. We computed the weights ourselves from August 2026 prices and checked them against externally published weights (deviation ≤ 0.5 percentage points, explained by the pricing date).
| Rank | Stock | Price (USD) | Weight | Cumulative |
|---|---|---|---|---|
| 1 | Goldman Sachs | 1,039.87 | 11.44% | 11.4% |
| 2 | Caterpillar | 840.60 | 9.25% | 20.7% |
| 3 | Microsoft | 508.26 | 5.59% | 26.3% |
| 4 | Amgen | 413.18 | 4.55% | 30.8% |
| 5 | UnitedHealth | 412.08 | 4.53% | 35.4% |
| … | Top 10 | 55.3% | ||
| 20 | Nvidia | 219.26 | 2.41% | |
| 30 | Nike | 41.73 | 0.46% |
The point sits in rank 1 and rank 20. Nvidia, at 5.31 trillion USD, is the most valuable company in the index and carries 2.41% weight. Goldman Sachs has a market capitalisation of 315 billion USD — rank 18 by market value — and, at 11.44%, the largest weight. One seventeenth of the market cap, 4.7 times the weight. A one-percent move in Goldman moves the index as much as a 4.7-percent move in Nvidia.
At sector level this comes out roughly as: financials around 27%, tech around 24.5%, industrials around 16.5%, health around 13.4%. Structurally, the Dow is a financials-plus-industrials index and the NQ a tech index.
2. Daily level: how much does a date move the day?
For every trading day we measured range (session high minus low), |return| (open to close) and |gap| (open versus previous close), all in units of the previous day's ATR20. Each date is compared against all remaining days (Welch t). Baseline: Dow range 1.029, |gap| 0.401, trend-day rate 31.2%; NQ range 1.031, |gap| 0.384, trend-day rate 34.0%.
| Date | n | Dow range Δ | NQ range Δ | Dow |gap| Δ |
|---|---|---|---|---|
| FOMC (exact, from 2021) | 43 | +0.423 (t = +4.1) | +0.355 (t = +3.6) | −0.106 (t = −2.6) |
| First of month | 137 | +0.178 (t = +3.1) | +0.158 (t = +3.1) | +0.065 (t = +1.8) |
| NFP (1st Friday, approx.) | 137 | +0.136 (t = +2.7) | +0.126 (t = +2.6) | +0.062 (t = +1.8) |
| Opex (3rd Friday) | 136 | −0.092 (t = −2.4) | −0.063 (t = −1.7) | −0.029 (t = −1.0) |
| Quad witching | 45 | −0.051 (t = −0.8) | +0.001 (t = +0.0) | +0.020 (t = +0.4) |
| Last of month | 137 | +0.054 (t = +1.1) | +0.018 (t = +0.4) | −0.049 (t = −1.8) |
At this level the two indices look almost identical. FOMC is the biggest movement day (+0.42 and +0.36 ATR more range), start of month and NFP follow, and opex is a quieter day, not a wilder one. The Dow-minus-NQ difference does not exceed 0.07 ATR on any date. One detail: on FOMC days the gap is smaller than usual (−0.106 ATR, t = −2.6) — the movement is purely intraday, after the 14:00 New York decision. The weekday barely matters: Monday, at 0.94 ATR range, is the quietest day in both indices, Wednesday and Thursday at 1.06–1.09 ATR the most active.
3. Setup level: does more movement mean more edge?
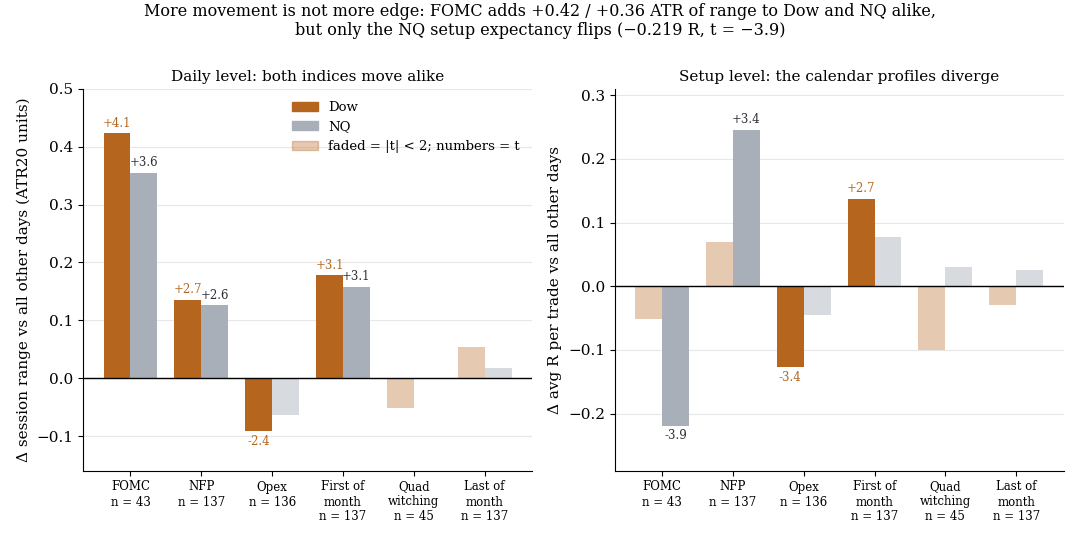
More movement is not more edge: FOMC widens the daily range of both indices alike, but only the NQ setup expectancy flips.
This is where the indices part ways. We sorted all episodes of our breakout setup family on Dow and NQ by date and compared the expectancy on each date against all remaining days. Baseline avgR: Dow +0.124 R (n = 20,804), NQ +0.045 R (n = 21,031). Standard errors clustered by day, because trades on the same day are not independent.
| Date | Dow trades / days | Dow Δ avgR (t) | NQ trades / days | NQ Δ avgR (t) |
|---|---|---|---|---|
| FOMC | 310 / 43 | −0.052 (t = −0.6) | 323 / 43 | −0.219 (t = −3.9) |
| NFP | 961 / 137 | +0.070 (t = +1.4) | 965 / 137 | +0.245 (t = +3.4) |
| Opex | 973 / 136 | −0.127 (t = −3.4) | 987 / 136 | −0.046 (t = −1.2) |
| First of month | 971 / 137 | +0.137 (t = +2.7) | 980 / 137 | +0.077 (t = +1.5) |
| Quad witching | 324 / 45 | −0.100 (t = −1.5) | 326 / 45 | +0.030 (t = +0.4) |
| Last of month | 980 / 137 | −0.029 (t = −0.7) | 985 / 137 | +0.025 (t = +0.4) |
The core finding: FOMC moves both markets almost equally, but the setup expectancy only flips on the NQ. On the NQ, a breakout setup loses 0.219 R on FOMC days relative to a normal day — against a baseline of +0.045 R, the day is clearly negative. On the Dow the effect is indistinguishable from zero. The reverse holds for NFP: the NQ gains +0.245 R (t = +3.4), the Dow only +0.070 R (t = +1.4).
The two significant Dow cells sit on dates the NQ does not care about: opex costs the Dow 0.127 R (t = −3.4), the first of the month adds +0.137 R (t = +2.7). Of twelve cells tested, four reach |t| ≥ 2.7 — more than chance would produce — and they split cleanly: two dates act only on the NQ, two only on the Dow.
4. The link to composition
A plausible, unproven explanation follows from section 1. The NQ is a tech index and therefore rate-sensitive — an FOMC decision hits its valuations head-on, and a breakout before 14:00 regularly ends up on the wrong side of the reaction. In the Dow, two blocks offset each other: banks benefit from rising rates, industrials suffer. The index moves just as much, but less uniformly — no disadvantage for a direction-neutral breakout setup.
That opex and the start of the month hit the Dow harder fits the picture: both are dates where flow and positioning dominate rather than news — compare the month-end mechanism. The data show that the profiles differ; why is hypothesis.
5. What this means
Range and edge are two different quantities. A date that measurably moves a day does not automatically make it better or worse for a setup. FOMC is the biggest movement day for both indices and a normal day for the Dow, a losing day for the NQ. Anyone deriving calendar filters from daily statistics is measuring the wrong level.
The Dow is not a clone of the NQ. This shows not only here — it is also the only index with a genuine long advantage in our long-versus-short study. Anyone trading both should run them as two markets with their own calendar, not as one market in two sizes.
6. Limits
- The index weights are a snapshot (August 2026). The ranking shifts with every price; only the structure is stable — a few expensive stocks dominate, market value plays no role.
- FOMC only 2021–2026 (43 days). The Fed no longer lists older decision dates; the FOMC row has its own, shorter period than the rest of the table.
- NFP is approximated as the first Friday of the month. Individual dates deviate from the actual rule.
- CPI, PCE, ISM, claims, ECB and BoE are missing. The full event matrix could not be measured for lack of calendar data; the ranking of drivers is therefore incomplete.
- No out-of-sample split. Twelve cells, four hits — a cluster, but any single cell could be subject to the pattern from our persistence study and shrink in the next half-year.
- The setup family is ours; a different rule set may have a different calendar profile. The composition explanation in section 4 is untested, merely consistent with the finding.
📄 Full study as PDF: 7 pages incl. all tables, figures and limits (in German).
Disclaimer: Historical statistics are no guarantee of future market behaviour. This study is not investment advice. Trading involves risk of loss up to total loss.