Note, 29 September 2026: Part of the R values in this study comes from our older backtest chain, which also books positive R on a random market without direction. Those values are too high; results that do not depend on the chain (price statistics, counts) are unaffected. Details: The random market as a ruler.
Re-run, 5 October 2026: The 25 combinations of breakout rule and market from our rulebook have been re-measured on the corrected chain and on real broker ticks. None has an advantage over the random market; after costs the mean is −0.08 R per trade. The affected R values in this study are therefore not proven, the other results are untouched. All numbers: Our own breakout rules, re-measured.
Data basis: 123,193 episodes, 10 markets, 23 setups, 05 Jan 2015 – 05 Jun 2026. Exit: trailing stop BE 0.5 / TS 1.0 / step 0.5, net of spread and slippage. Drift decomposition on M1 data, cash sessions in each market's local time zone. No trading recommendation.
The reasoning sounds airtight. Equity indices rise over the long run. A long trade therefore has the drift at its back and a short trade against it. Long setups should perform measurably better.
They do not. The premise is correct — the conclusion does not follow, and the reason is a timing mismatch that is easy to overlook.
1. Long versus short, measured
| Comparison | Long | Short | Difference |
|---|---|---|---|
| Pooled, trailing exit | +0.077 (n=66,289) | +0.081 (n=56,904) | −0.004 (t = −0.6) |
| Pooled, hold to session end | +0.021 | +0.010 | +0.011 (t = +0.8) |
| Only days where both directions triggered | +0.072 (n=55,755) | +0.082 (n=49,802) | −0.010 (t = −1.3) |
The third row is the fair comparison. Long and short episodes are not the same days — an upside break and a downside break happen under different conditions — so the pooled figures compare slightly different populations. Restricting to days where the same market triggered in both directions removes that objection. The result does not move: no advantage for long, if anything a shade in favour of short.
2. The resolution: the drift happens while you are not trading
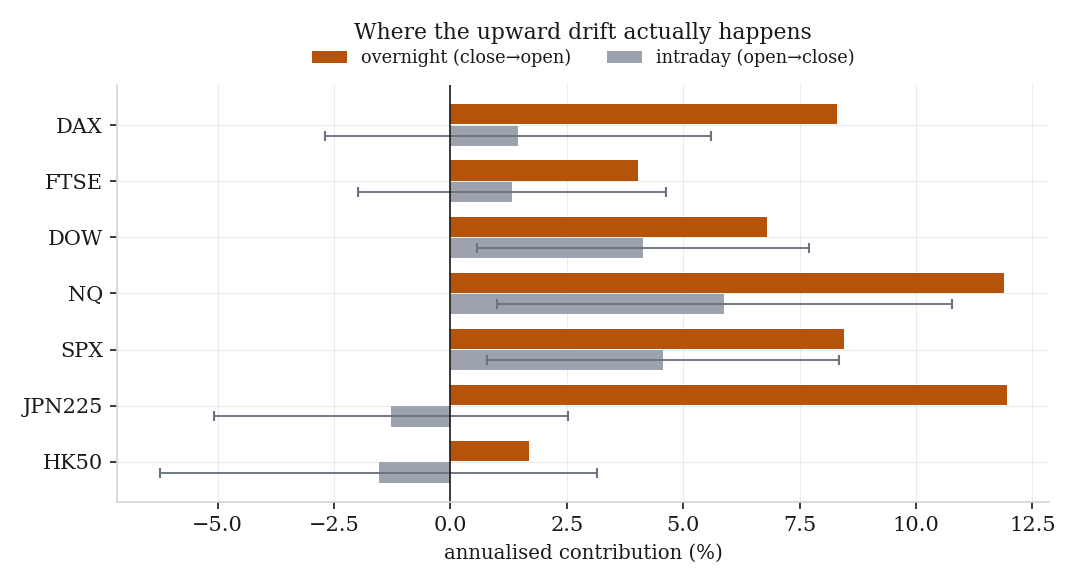
Split every trading day into two parts. Overnight is previous session close to next session open — the hours a position is only exposed if held through. Intraday is open to close, the window in which an intraday setup actually lives.
| Market | Overnight | Intraday | Total | Overnight share |
|---|---|---|---|---|
| DAX | +8.30 %/yr | +1.46 % (t = +0.4) | +9.76 % | 85% |
| FTSE | +4.03 % | +1.33 % (t = +0.4) | +5.35 % | 75% |
| NQ | +11.89 % | +5.88 % (t = +1.2) | +17.77 % | 67% |
| SPX | +8.45 % | +4.56 % (t = +1.2) | +13.01 % | 65% |
| DOW | +6.80 % | +4.13 % (t = +1.2) | +10.93 % | 62% |
| JPN225 | +11.95 % | −1.28 % (t = −0.3) | +10.67 % | 112% |
| HK50 | +1.68 % | −1.54 % (t = −0.3) | +0.14 % | — |
The decisive column is not the share — it is the t-statistic. Not one intraday value is statistically distinguishable from zero. Across seven indices and eleven years, the open-to-close drift is indistinguishable from a flat line. The entire long-run rise is carried by the gaps.
This is not a quirk of our data; the overnight effect is well documented in the academic literature. What matters here is the consequence: an intraday setup holding a position for a few hours inside the session sits precisely in the window where the drift is absent.
3. The size check
If the drift did feed through to intraday setups, how large would the long-short gap have to be? The unit of a setup is R, defined by its reference-candle range. Converting the index drift into that unit gives an upper bound:
| Market | drift per day | reference range | expected long−short | measured |
|---|---|---|---|---|
| DAX | 0.032% | 0.156% | +0.406 R | −0.011 |
| SPX | 0.040% | 0.130% | +0.609 R | −0.002 |
| NQ | 0.056% | 0.190% | +0.586 R | +0.036 |
| DOW | 0.036% | 0.138% | +0.516 R | +0.066 |
The expected column assumes a position held for a full calendar day and is therefore an upper bound — real holding periods are hours. But the gap between expectation and measurement is not a matter of degree. Essentially none of the drift arrives.
4. Where directional differences do exist
The pooled null result hides real structure — just not the structure the premise predicts.
| Market | Long | Short | Difference |
|---|---|---|---|
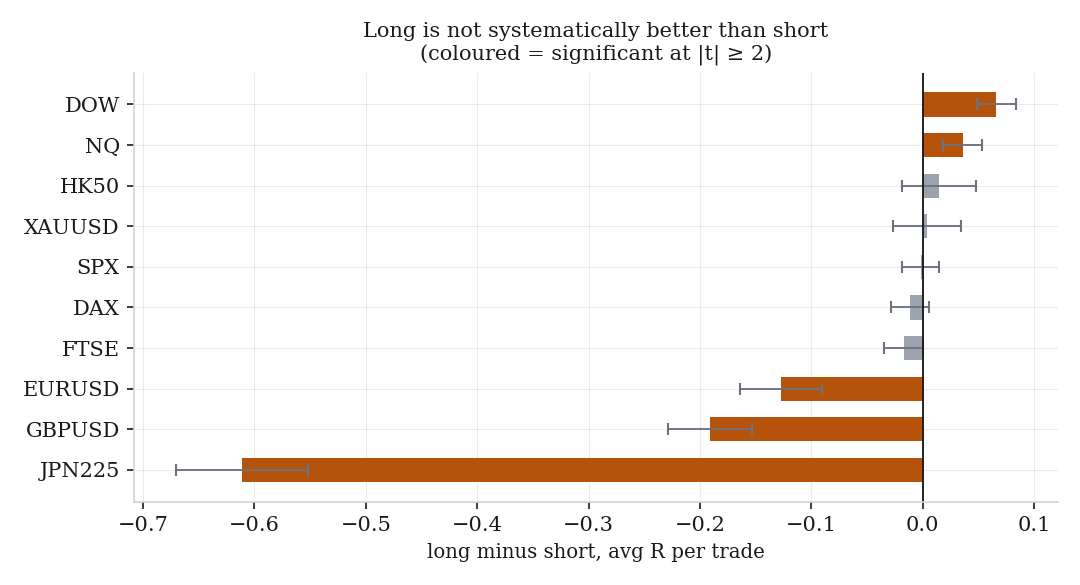
| DOW | +0.155 | +0.090 | +0.066 (t = +3.8) |
| NQ | +0.061 | +0.025 | +0.036 (t = +2.1) |
| DAX | +0.152 | +0.164 | −0.011 (t = −0.7) |
| SPX | +0.045 | +0.047 | −0.002 (t = −0.1) |
| EURUSD | −0.135 | −0.008 | −0.128 (t = −3.5) |
| GBPUSD | −0.141 | +0.050 | −0.191 (t = −5.1) |
| JPN225 | −0.191 | +0.420 | −0.611 (t = −10.3) |
DOW is the one index with a genuine long advantage — and it survives a Bonferroni correction across ten markets. That is a real, tradeable asymmetry, and it is the exception rather than the rule.
The large negative numbers point the other way. On JPN225 and the FX pairs, short is clearly better. JPN225 is a setup effect rather than a market effect — only one setup runs there. But it makes the point: if a general upward drift drove setup performance, you would not find −0.61 R differences in the opposite direction.
5. The finding that should stop you generalising
Split the sample into epochs and the sign flips:
| Epoch | Long | Short | Difference |
|---|---|---|---|
| 2015–2018 | +0.020 | +0.030 | −0.010 (t = −0.9) |
| 2019–2022 | +0.086 | +0.117 | −0.031 (t = −2.6) |
| 2023–2026 | +0.129 | +0.098 | +0.031 (t = +2.4) |
Both significant epochs point in opposite directions. Anyone who concluded in 2022 that "short is structurally better" and rebuilt their system around it would be positioned exactly wrong today.
This is the pattern described in our edge persistence study: a difference that flips sign between periods is a fresh anomaly, not a structural edge. It should be shrunk to near zero, not acted on.
6. What this means
The premise "the market rises" is true and irrelevant for intraday direction selection. The drift is real but arrives in a window intraday systems do not occupy.
Two consequences worth keeping:
A long bias is not a free edge. If you want directional bias, it has to come from something measured in the setup itself — the DOW asymmetry, or a per-day condition such as the colour of the reference candle — not from the long-run chart.
The drift does explain something else: why European indices react to a US afternoon sell-off only the next morning. The DAX closes at 17:30 Berlin, while the US session runs to 22:00. It cannot price in what happens after its own close — so it does it in the gap. With 85% of DAX movement occurring overnight, that gap is where the index does most of its work.
7. Limits
- Observational, not experimental. Long and short episodes arise under different conditions. The both-directions comparison mitigates this but does not eliminate it.
- No conditioning on setup logic. Our own continuation model (green reference candle → long, red → short) beats an unconditional directional choice; this study deliberately tests the unconditional premise.
- CFD data, no dividends. The overnight figures include index gaps and are descriptive — holding overnight on CFDs carries financing costs that are not modelled here. Nothing in this paper is an argument for overnight positions.
- The setup family is ours. 23 setups, historically selected. Relative comparisons are robust; absolute levels are optimistic.
📄 Full study as PDF: 7 pages incl. all tables, figures and limits (in German).
Disclaimer: Historical statistics are no guarantee of future market behaviour. This study is not investment advice. Trading involves risk of loss up to total loss.