
Data basis: NQ, SPX, DOW — M1 data, 05 Jan 2015 – 05 Jun 2026, 2,944 trading days per index. US session 09:30–16:00 New York; EU close = 17:30 Berlin, converted per day (Berlin and New York switch daylight saving on different dates). Pure price statistics, no costs or slippage modelled. No trading recommendation.
European indices close at 17:30 Berlin — 11:30 in New York. The US session then runs another four and a half hours. Everything that happens in that window is invisible to the European cash market until the next morning's gap.
That asymmetry produces a recurring hope: the US is deeply red by the European close, and surely at some point it turns. This paper measures how often it actually does.
1. Definitions, because "V-reversal" means three different things
Decline is measured from the US open to the EU close. Timon's question concerned a drop of 1–2% in that window. The observation window runs from the EU close to the US close.
Three reversal thresholds, from weakest to strongest:
- R1 — any recovery: the US closes above where it stood at the EU close.
- R2 — half V: at least 50% of the day's loss is recovered.
- R3 — full V: the US closes back at or above its own opening price.
2. The answer
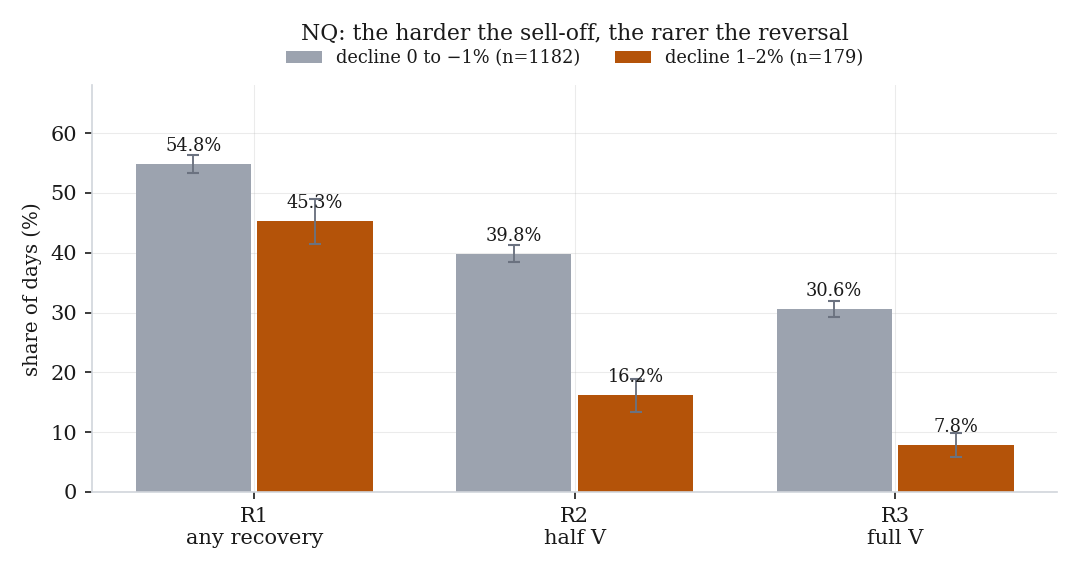
NQ, decline of 1–2%: 179 days out of 2,944 — 6.1% of all trading days.
| any recovery | half V | full V | |
|---|---|---|---|
| NQ (n=179) | 45.3% | 16.2% | 7.8% |
| SPX (n=85) | 42.4% | 20.0% | 9.4% |
| DOW (n=78) | 41.0% | 16.7% | 7.7% |
A genuine V — back to the open — happens on roughly one day in thirteen. Even relaxing the requirement so the V only has to become visible at some point after the EU close, without holding into the close, gets you to just 13.4% on the NQ.
Note also that R1 sits below the unconditional base rate: on all days the US closes above its 11:30 level 56.2% of the time, but after a 1–2% decline only 45.3% of the time.
3. The counterintuitive part
Compare declines against declines, and the expectation inverts:
| NQ | any recovery | half V | full V |
|---|---|---|---|
| Decline 0 to −1% (n=1,182) | 54.8% | 39.8% | 30.6% |
| Decline 1–2% (n=179) | 45.3% | 16.2% | 7.8% |
The harder the sell-off, the less likely the reversal — from 30.6% down to 7.8%. A strong decline is not a stretched rubber band. It is a trend day, and the US afternoon session is more likely to continue it than to reverse it.
The average move after the EU close confirms it: −0.12% on NQ decline days versus +0.02% across all days (t = −1.6). Not significant, but certainly not an upward bias either. The same picture holds on SPX (−0.18%) and DOW (−0.18%).
The pattern is consistent across all three indices, which matters — three markets producing the same ordering is harder to dismiss than one.
A benchmark caveat we have to flag. For R2 and R3 the unconditional "all days" base rate is distorted and should not be used for comparison. On days that close up, the 50% threshold mathematically falls below the EU-close price and is therefore satisfied almost automatically — which is why "up days" score 79% on R3. Only the decline-versus-decline comparison above is valid. We mention it because the invalid comparison is the one that would have made this study look far more impressive.
4. These days are not evenly distributed
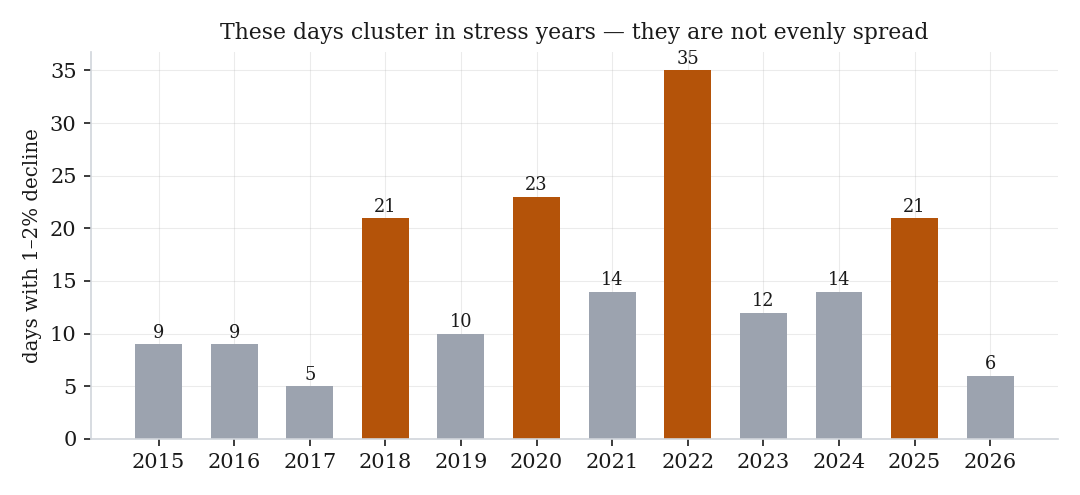
| Year | 2015 | 2016 | 2017 | 2018 | 2019 | 2020 | 2021 | 2022 | 2023 | 2024 | 2025 | 2026 |
|---|---|---|---|---|---|---|---|---|---|---|---|---|
| NQ days | 9 | 9 | 5 | 21 | 10 | 23 | 14 | 35 | 12 | 14 | 21 | 6 |
2022 alone contributes 35 of the 179, with 2020, 2018 and 2025 close behind. The 6.1% figure is an average over regimes, not a constant. In a calm year these days barely occur; in a volatility regime they cluster. Any expectation built on the base rate has to account for which regime you are in.
5. What this is good for
Not for a trade. The honest reading is a prior: when the US is down 1–2% at the European close, the base case is continuation, not reversal — and the stronger the decline, the more firmly so.
That is worth something mainly as a defence. The instinct to buy a hard sell-off late in the session because "it always comes back" is measurably wrong here: it comes back fully on 7.8% of such days, and the milder declines that do revert are precisely the ones that feel less compelling to trade.
6. Limits
- Pure price statistics. No costs, no slippage. A reversal identified in hindsight says nothing about whether it was tradeable — no entry rule is defined, and a 13.4% "intraday-visible V" is not an entry signal.
- The 1–2% band was given, not optimised. That is a strength: the threshold was not tuned to the data. But it also means neighbouring definitions were not explored.
- Small n at the extremes. Declines worse than −2% occur on 22 days (NQ), 7 (SPX) and 5 (DOW) — too few for any statement, which is why they are excluded above.
- CFD data, no dividend adjustment.
- Not tested: whether news-driven declines behave differently from drift-driven ones, and whether the reversal rate depends on the volatility regime beyond the frequency clustering shown here.
📄 Full study as PDF: 6 pages incl. all tables, figures and limits (in German).
Disclaimer: Historical statistics are no guarantee of future market behaviour. This study is not investment advice. Trading involves risk of loss up to total loss.