Open Research

Measurements, not opinions.

42 studies on 123,193 measured episodes — each with its data basis, methodology and stated limits, including the ideas that did not survive the test. Filterable by verdict, including "no edge".

In this area

From edge to EA

6 parts

One edge from the first measurement to a running expert advisor — five phases, one continuous example, every number traceable.

  1. StartThe workflow at a glanceMethodology: How to Develop a Trading Algorithm Honestly — a Reference Run
  2. Phase 1Idea & dataTrend-Day Detection via the 2nd Opening Candle
  3. Phase 2Building the edge (in-sample)Exit Logic for the 2nd-Candle Breakout: Does Moving the Stop Pay Off?
  4. Phase 3The validation gateThe Validation Gate: Does the 2nd-Candle Edge Survive Out-of-Sample, Walk-Forward & Monte-Carlo?
  5. Phase 4Position sizingPosition Sizing & Kelly: How Much Risk on the Validated Edge?
  6. Phase 5Deployment & reality checkThe Finished Algorithm: MT5 Expert Advisor & Reference Backtest

Shared basis

Episodes
123,193
Markets
10
Data from
2015
Resolution
M1 (Dukascopy)
Costs
net, 1 pt

Every study additionally names its own sample and period in its header.

The methodology in detail →
All measurements

42
No edgeCandle patterns · 9 min read

The Doji Trap on the 2-Minute Chart: Trapped Sellers or Just Noise?

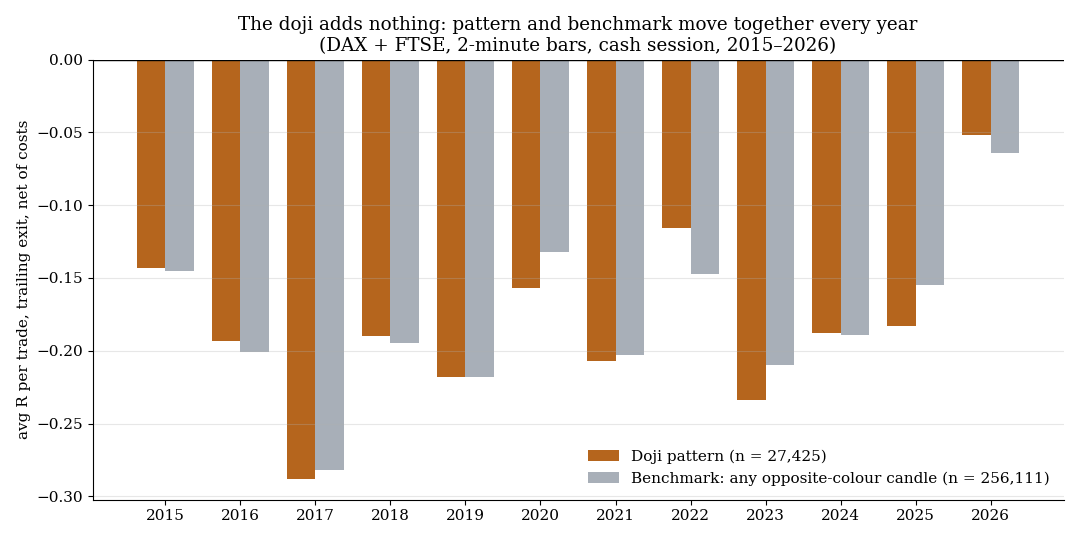
Doji, opposite-colour candle, break of its extreme — on a 2-minute chart it looks like trapped traders. Across 27,425 patterns on DAX and FTSE (2015–2026) it returns −0.186 R net, exactly as bad as the benchmark 'every opposite-colour candle' (−0.184 R). The doji carries zero information, and costs eat 31 to 43% of the risk.

MeasuredRegime & filters · 7 min read

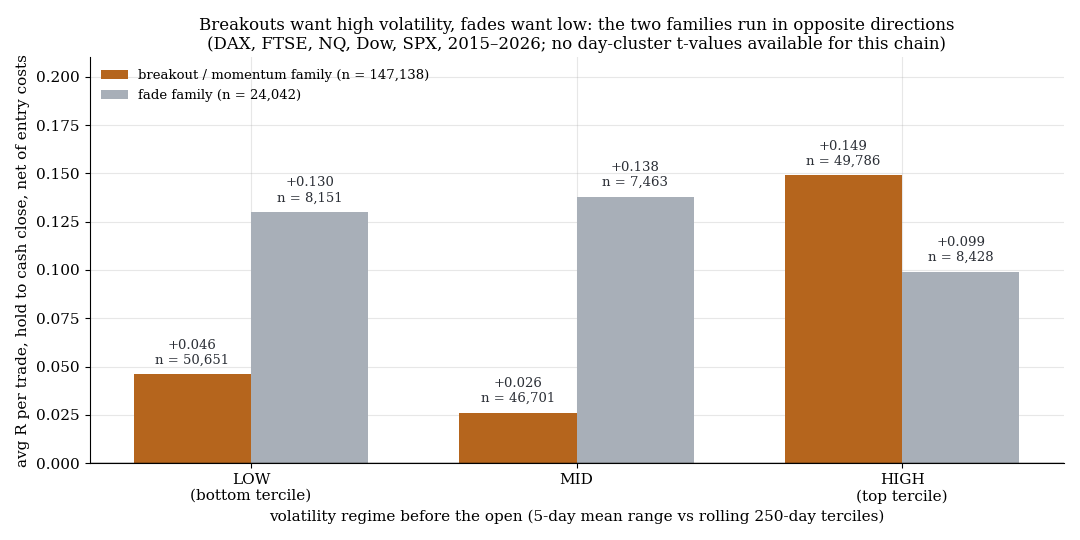
Breakouts Need High Volatility, Fades Need Low — a Regime You Know Before the Open

Across 171,180 index trades, breakout setups run at +0.149 R in the top volatility tercile and +0.046 R in the bottom one. Fade setups flip the picture: +0.130 R in low, +0.099 R in high volatility. The regime is known before the open, but honestly counted it costs more than it earns: as a filter it cuts max drawdown from −449 to −259 R for 17–19% of return — insurance, not edge.

MeasuredRegime & filters · 8 min read

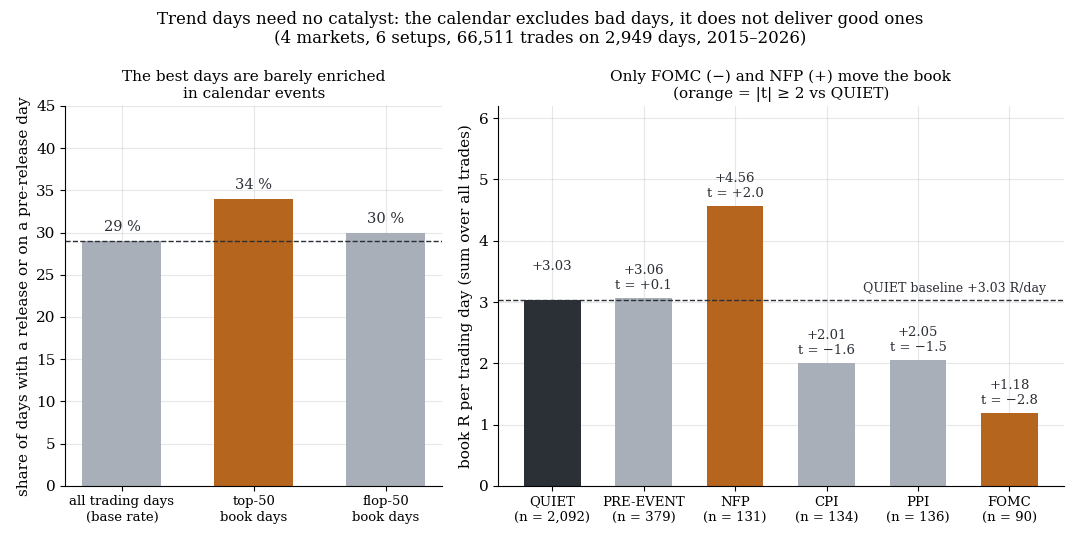
Do Trend Days Need a Catalyst? Eleven Years of Calendar Events vs Book Days

Intuition says big trend days come from news. Across 2,949 trading days and 66,511 trades we do not find that. Only 34% of the 50 best book days fall on event days or the day before one; the base rate is 29%. The calendar works for excluding — FOMC days push the US session to −0.10 R/day against +1.19 on quiet days (t = −2.9) — not for collecting.

No edgeExit mechanics · 8 min read

Exit on the Second Counter-Candle: Does a Mechanical Exit Beat the Trailing Stop?

An exit that flattens the position on the second counter-candle on M5 sounds like the clean answer to profits given back. Across 66,511 trades and eleven years it loses to the trailing stop in every market and every setup: paired −0.072 R per trade (t = −15.8). An observation month that seemed to confirm it hung on a single trend day.

MeasuredRegime & filters · 10 min read

A Breakout Book over Eleven Years: Why the Total Is the Wrong Number

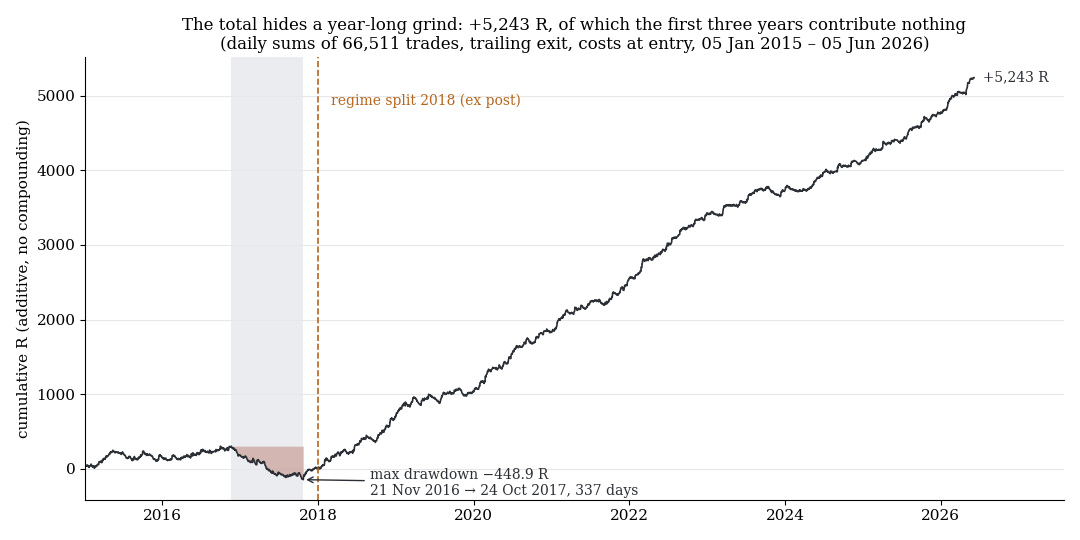
Six breakout setups on DAX, FTSE, Dow and Nasdaq, unselected, 66,511 trades from 2015 to June 2026: +5,243 R. The number is correct and misleading. Three of those years were dead (+15 R, drawdown −449 R); the remaining eight deliver +621 R per year at −136 R drawdown. What counts as a bad month depends on which of the two distributions you ask.

MeasuredCandle patterns · 10 min read

Breakout Price Action: Does the Candle Shape Matter — or Only the Close?

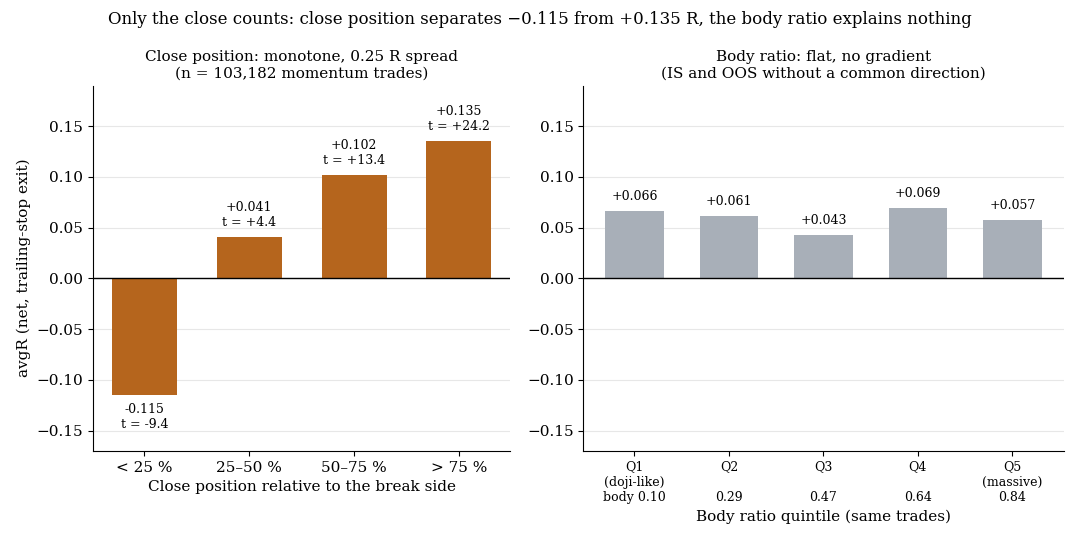
Hammer, doji, fat body, long wick: we put the shape of the reference candle against the success of the breakout, across 4 million breaks on gold/FX and 103,182 momentum trades on our episode basis. Result: the close relative to the break side separates −0.115 R from +0.135 R (t = +24.2), body ratio explains practically nothing within the close classes, and the weekday does not survive out-of-sample.

No edgeMarkets compared · 8 min read

Is a Third Index Worth It? SMI, CAC 40 and CA60 Against the Same Method

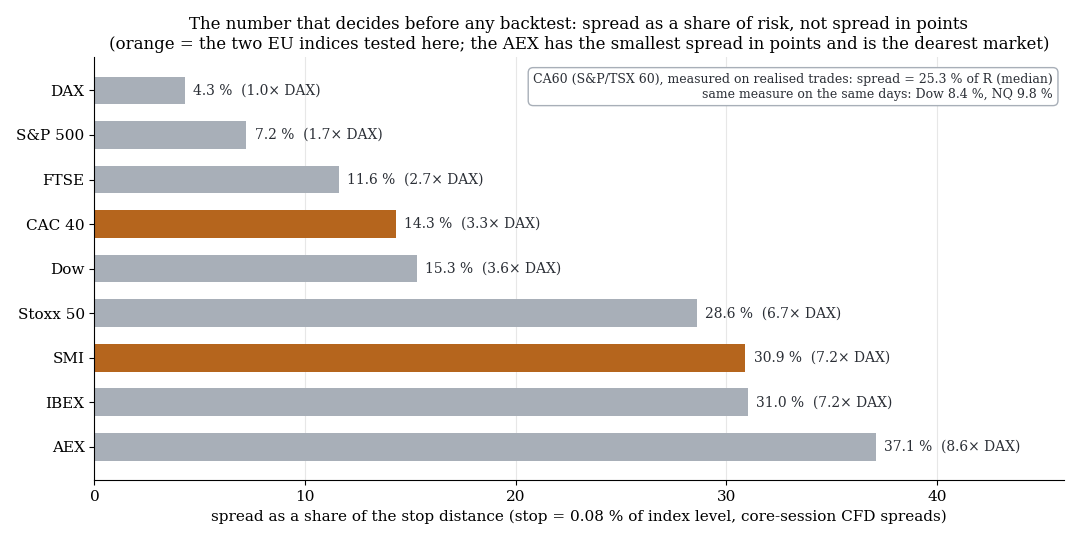
We ran our setup family on three additional indices. The SMI loses −0.098 R net (n=20,433), the CAC 40 keeps +0.078 R and still makes the portfolio worse, and the Canadian CA60 has a raw edge of +0.172 R that flips to −0.138 R after costs. The metric that decides is not the spread in points but the spread as a share of the risk.

No edgeOpening candle · 8 min read

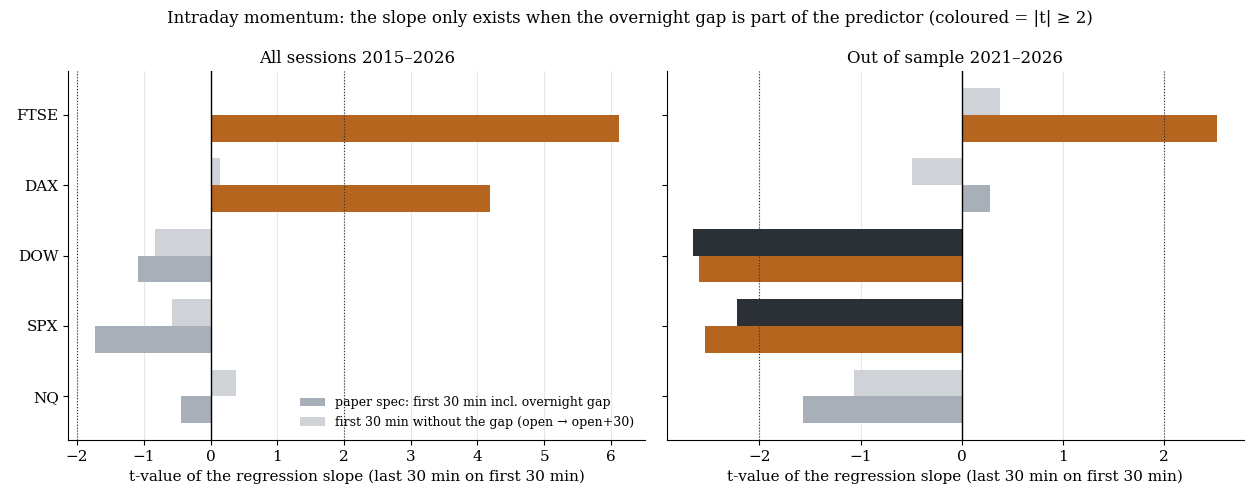
Does the First Candle Set the Day? Only If You Count It Twice

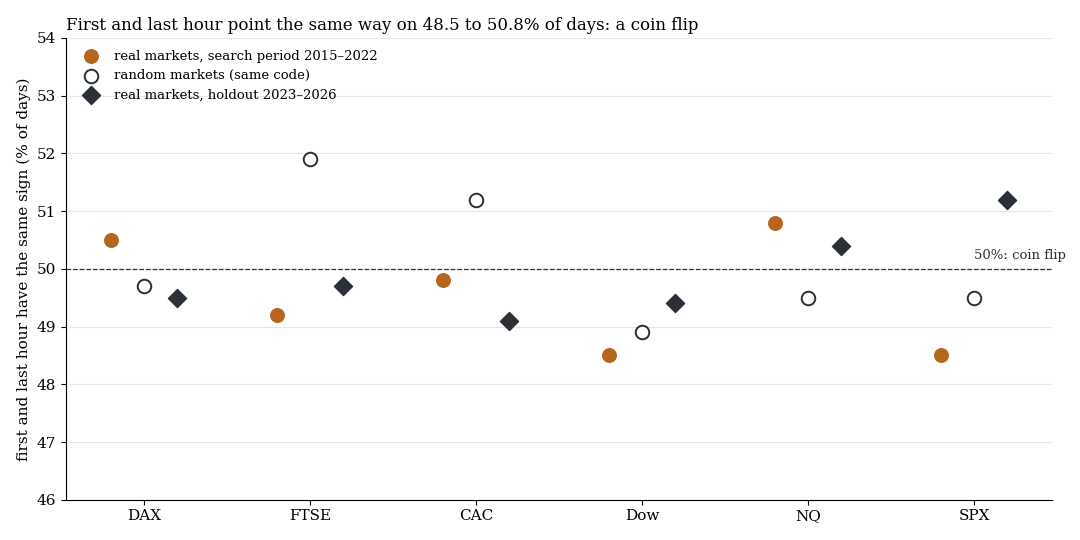
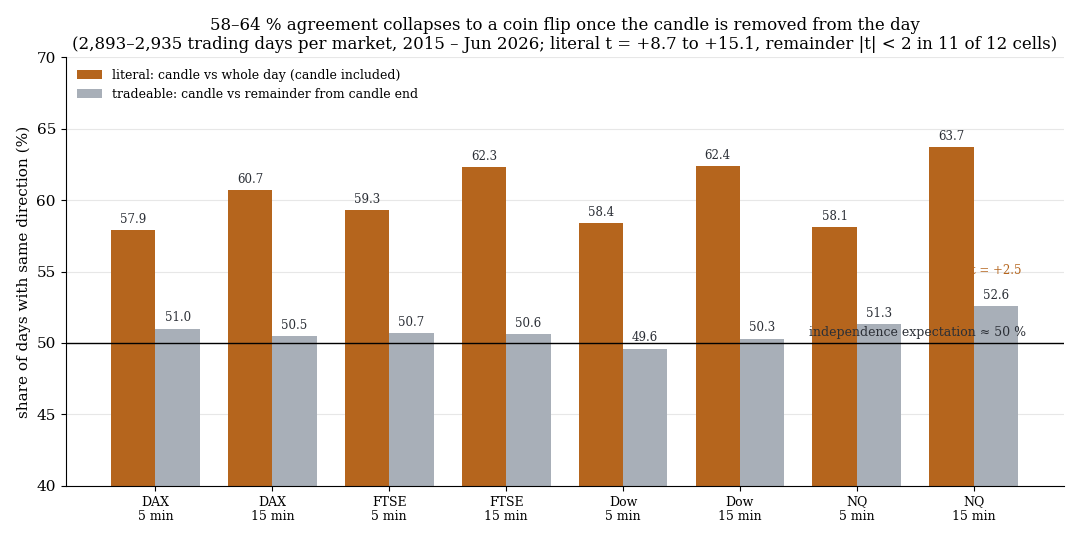
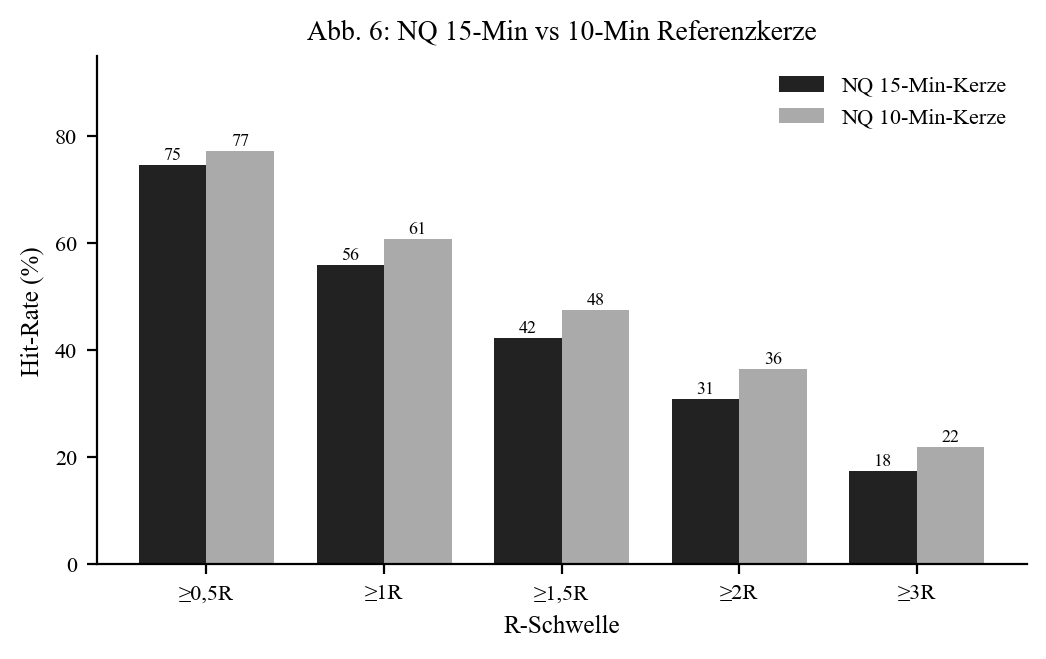
The first 5-, 10- or 15-minute candle after the cash open matches the day's direction on 58 to 64% of days — with t-values of 9 to 15. It sounds like a forecast, but it is arithmetic: the candle is part of the day. Measure the day from the candle's end and 49.6 to 52.6% remain — a coin flip in 11 of 12 market-window cells. Only the 15-minute candle on NQ shows a weak residual.

No edgeStudies · 10 min read

Is the Pre-Market Fade Dying Because Too Many People Trade It?

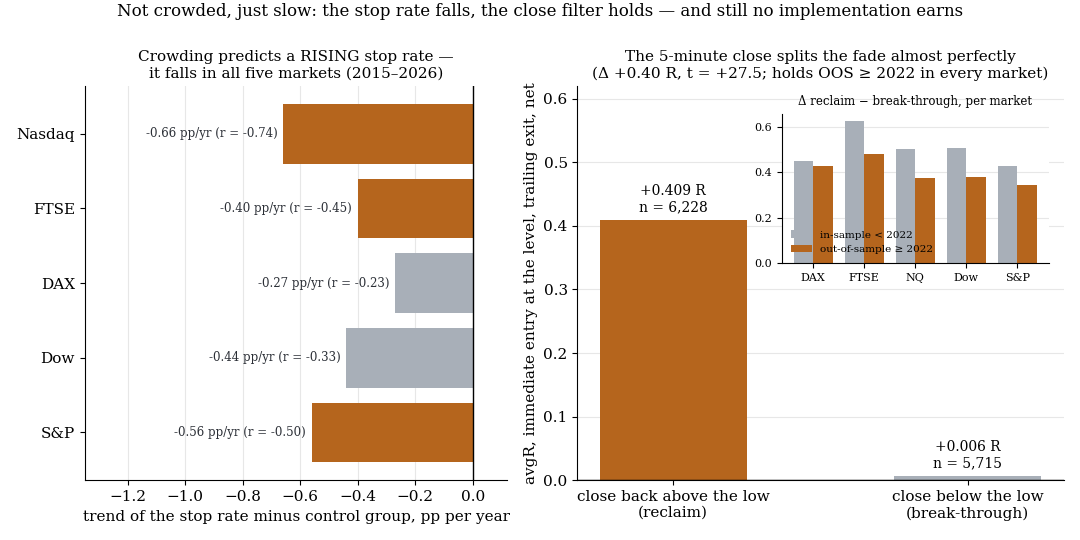
The low gets taken out once more after entry — so the level is known and gets deliberately swept? Across eleven years and five indices the data show the opposite: the stop rate is falling, also relative to every other setup in the same market. A 5-minute close separates +0.409 R from +0.006 R (t = +27.5, OOS-stable) — and still cannot be traded.

MeasuredRegime & filters · 8 min read

The Pre-Open Push in DAX and FTSE: Not a Direction Forecast, but a Setup Filter

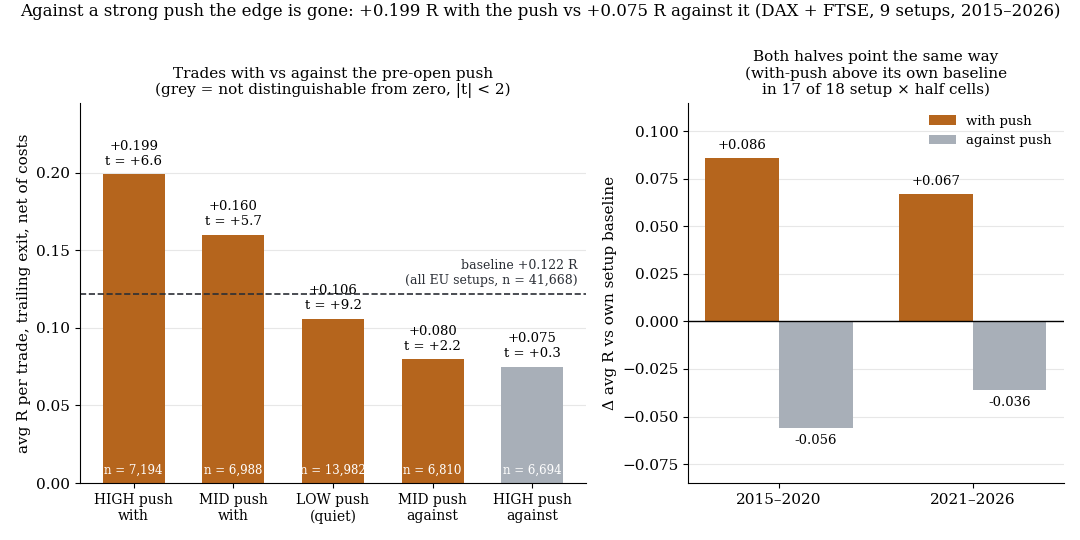
A strong push between 08:00 and 09:00 Berlin says nothing about the day's direction: 51.5% of days close in the push direction, 69% erase it completely. As a filter on 41,668 setup episodes it still works — trades with the push +0.199 R (t = +6.6), against the push +0.075 R (t = +0.3), baseline +0.122. The difference holds in both halves of the sample and in 17 of 18 setup cells.

ReferenceFoundations · 8 min read

The Volume Filter That Invented an Edge: Phantom Edges in Low-Volume Windows

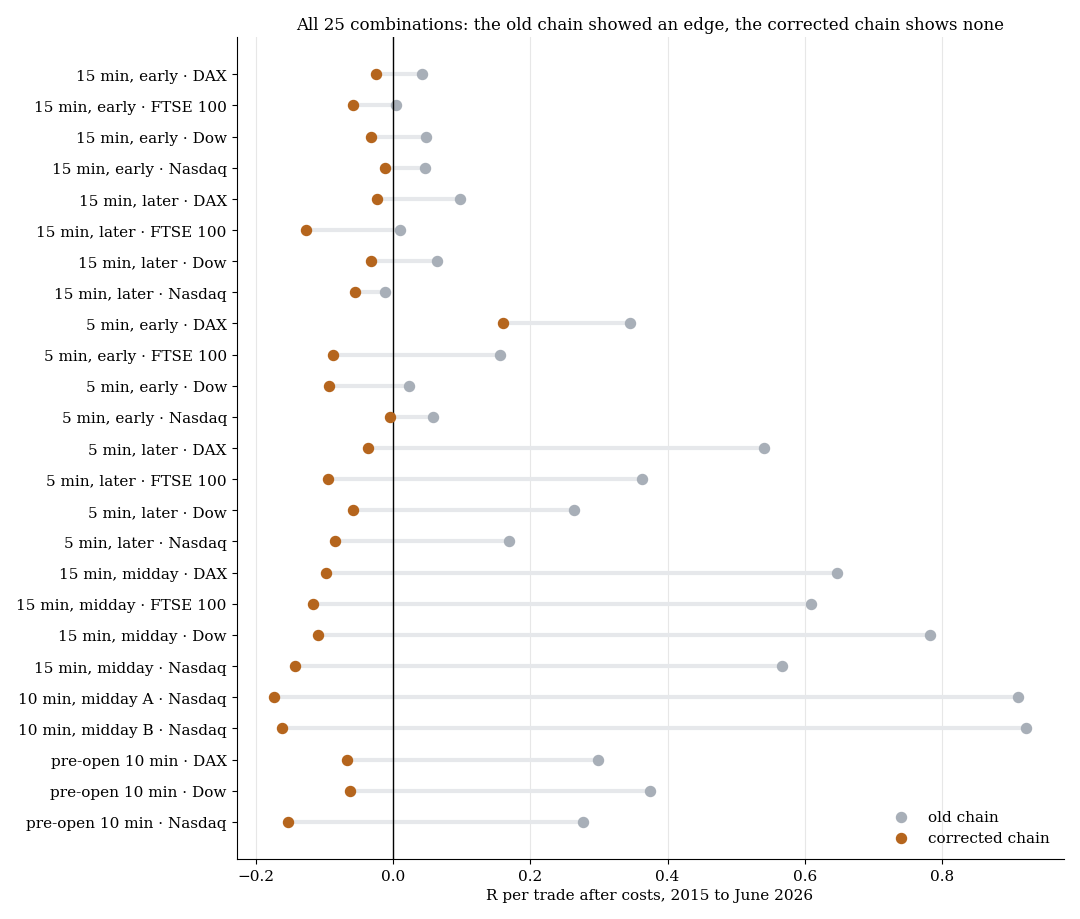
A breakout setup in the US midday lull showed +0.90 R at a 60% win rate — it would have been the best setup in our system. Without the volume confirmation filter: −0.11 R at 29%. The filter had shifted the trigger by a median of 100 minutes while the entry stayed booked at the old level. A case study in a lookahead trap that any backtest with volume confirmation can reproduce.

No edgeMarket mechanics · 8 min read

Two Midday Breakouts in the US Market: Does the First Break Say Anything About the Second?

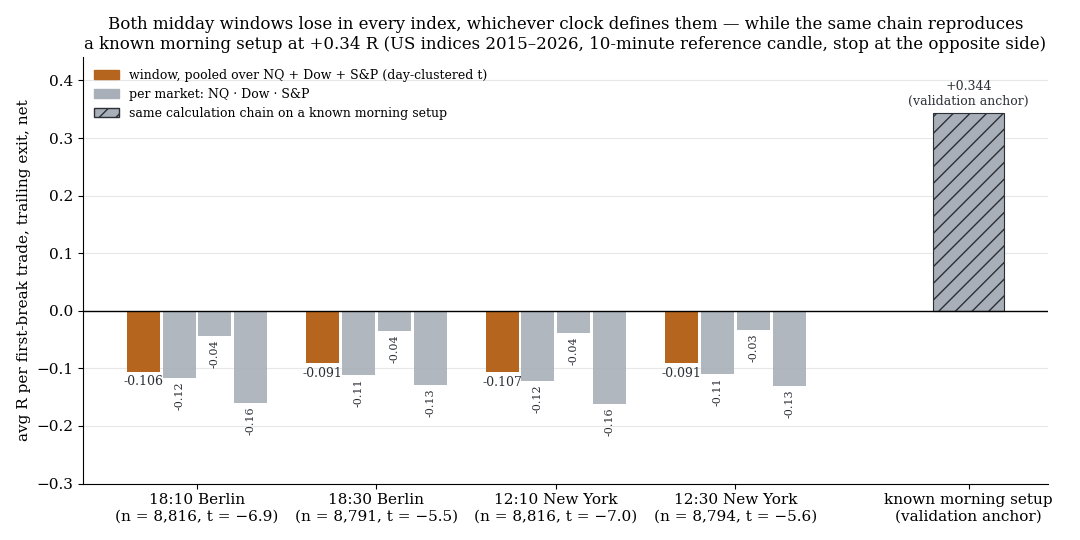
Two 10-minute reference candles around US midday (18:10 and 18:30 Berlin), breakout in both directions, stop at the opposite side. Across roughly 8,800 first-break trades per window on NQ, Dow and S&P (2015–2026) both are negative: −0.106 R (t = −6.9) and −0.091 R (t = −5.5). And the direction of the first break says nothing about the second: 52.6% versus 52.0%, chi-squared = 0.2. The first attempt showed +0.90 R — a volume-gate artefact.

No edgeMarkets compared · 8 min read

Reference Candles on FX and Gold: The Morning Is Dead Net of Costs, the Afternoon Is Not

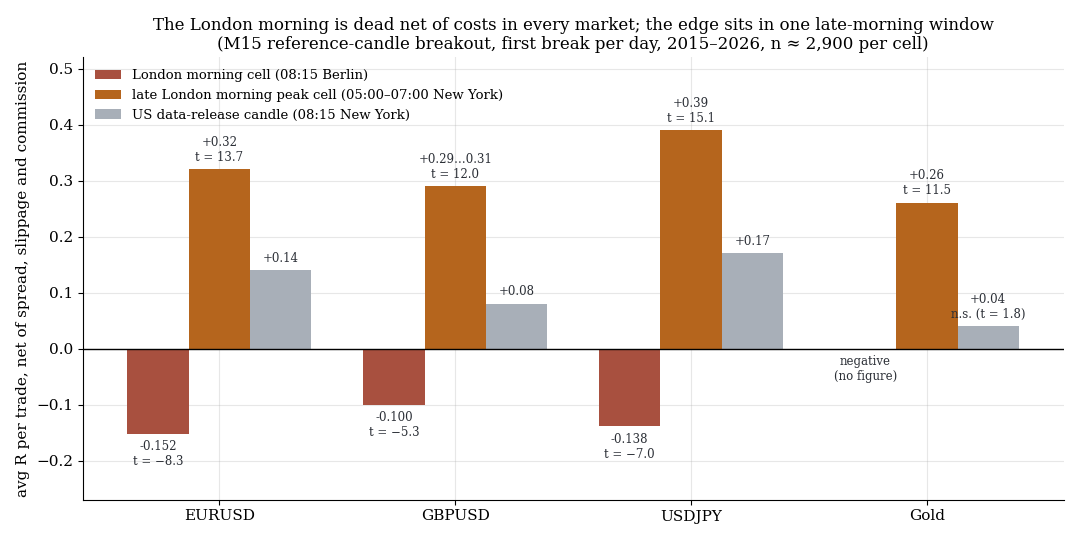
We ran the reference-candle breakout across 30 time cells on EURUSD, GBPUSD, USDJPY and gold, net of commission. The London morning window loses everywhere (EURUSD −0.152 R, t = −8.3; n ≈ 2,900 per cell), and so does its mirror image as an anti-breakout (−0.186 R). Only one window holds, in the late London morning: USDJPY +0.39 R (t = 15), gold +0.26 R (t = 11.5), in both sub-periods.

No edgeCandle patterns · 7 min read

Pin Bar After the Breakout Entry: Strong Classifier, Useless Rule

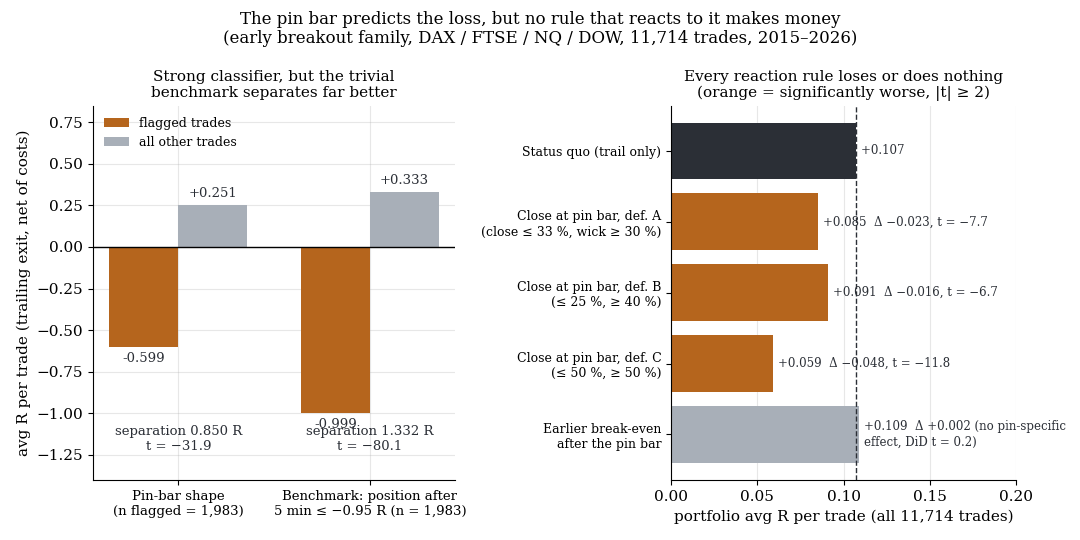
When the first 5-minute candle after a breakout entry is a pin bar with its wick pointing in the break direction, the trade ends at −0.599 R on average instead of +0.251 R (n=11,714, t = −31.9). Yet no reaction to it helps: closing immediately costs 0.023 R per trade at portfolio level, an earlier break-even adds +0.001 R. The pin bar is a proxy for where the trade stands after five minutes, not a shape effect.

No edgeExit mechanics · 8 min read

Holding the FTSE to the US Close: Does a Strong US Afternoon Carry the London Trade Further?

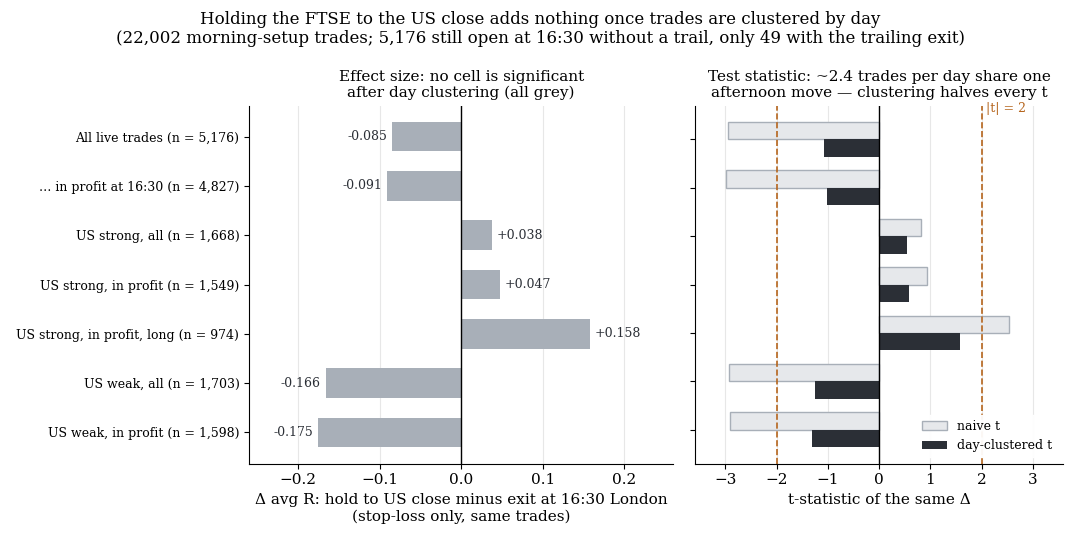
The US session is strong, the FTSE had a good push into the second half of the day — is it worth holding the trade past the London close until the US cash close? At the day level this yields +1.10 points (n=500, t = +0.76); at the trade level the question is almost moot: with a trailing exit, 49 of 22,002 episodes are still alive at 16:30 London. And the one cell that looked naively significant (t = +2.54) drops to t = +1.57 after day clustering.

MeasuredMarkets compared · 8 min read

Why Does the Dow React to Different Dates Than the Nasdaq? Price Weighting and the Calendar Profile

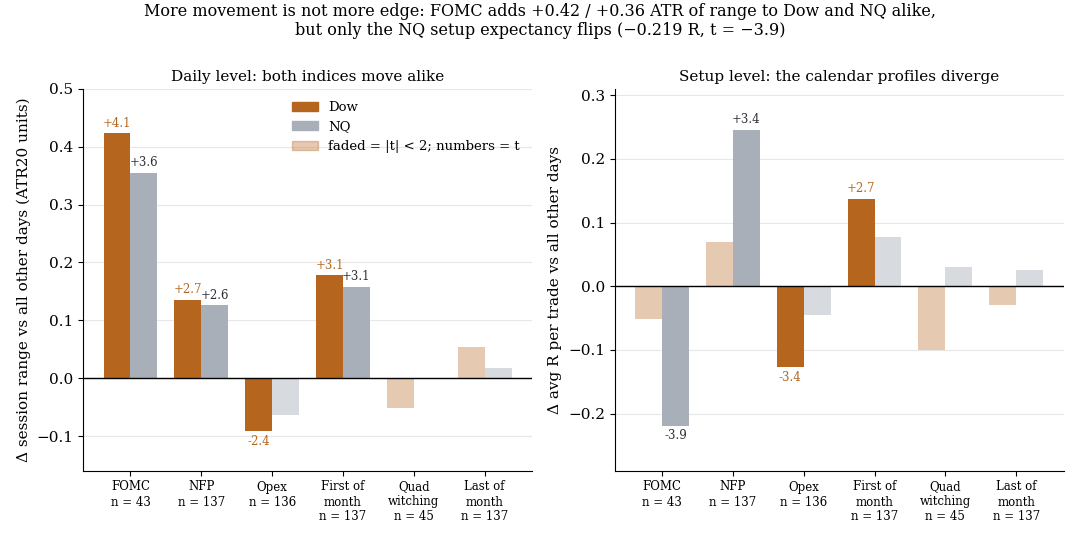
The Dow is price-weighted: its two most expensive stocks make up 20.7% of the index, the world's most valuable company only 2.4%. That makes it a financials-plus-industrials index — and it shows in the calendar. FOMC moves Dow and NQ almost equally (range +0.42 and +0.36 ATR), but the setup expectancy only flips on the NQ (−0.219 R, t = −3.9). More movement is not more edge.

ReferenceFoundations · 9 min read

Understanding Trading Algorithms: Types, Possibilities, Traps

The entry point for everyone who wants to trade automatically or already does: what a trading algorithm really is, which families exist and what kills each of them, what is realistically achievable — and the four traps where most systems fail before they ever go live.

No edgeMarket mechanics · 7 min read

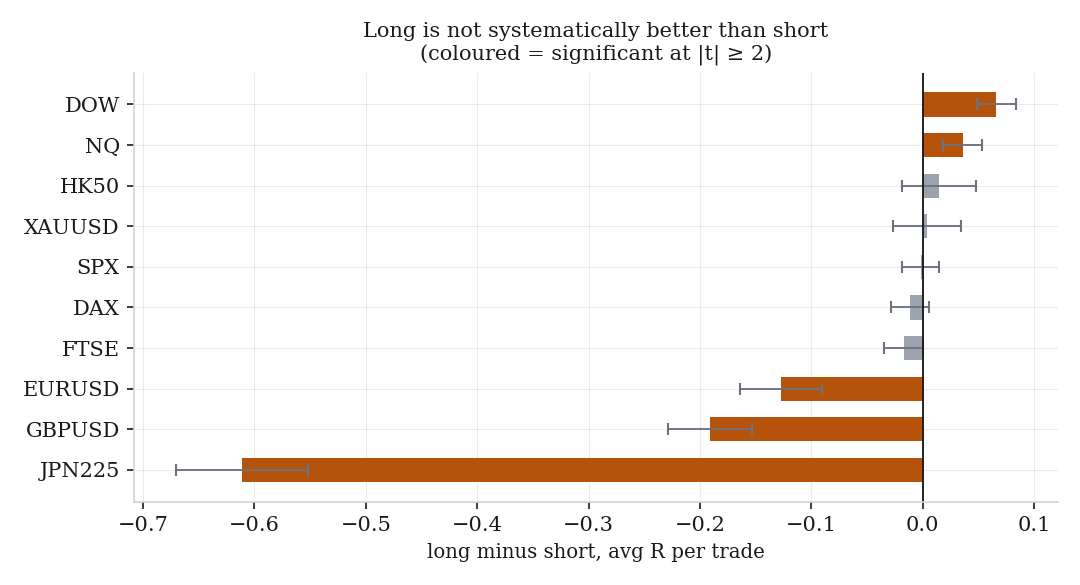
The Market Goes Up — So Why Doesn't Long Beat Short?

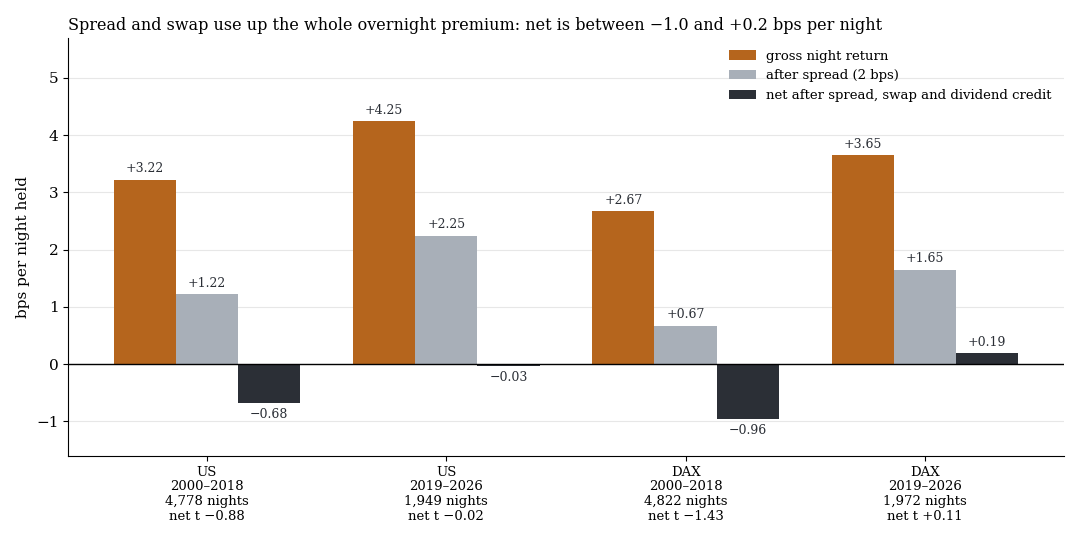
Indices rise over the long run, so intraday long setups should have a tailwind. Across 123,193 trades they do not: long +0.077 R vs short +0.081 R. The reason is a timing mismatch — 62 to 85% of the upward drift happens overnight, in the hours when intraday setups are not in the market.

ReferenceFoundations · 8 min read

Post-mortem: Four Features That Looked Into Their Own Future

Four context features in our episode base contained information that did not yet exist at entry time. 60,129 of 123,193 episodes were affected. A prediction model's tercile spread fell from +0.726 R to +0.191 R after the fix. How we found, proved and closed the leak — and why the models trained on it cannot be salvaged.

Edge confirmedMethodology · 10 min read

Edge Persistence: Does a Measured Edge Survive — and Which Part of It?

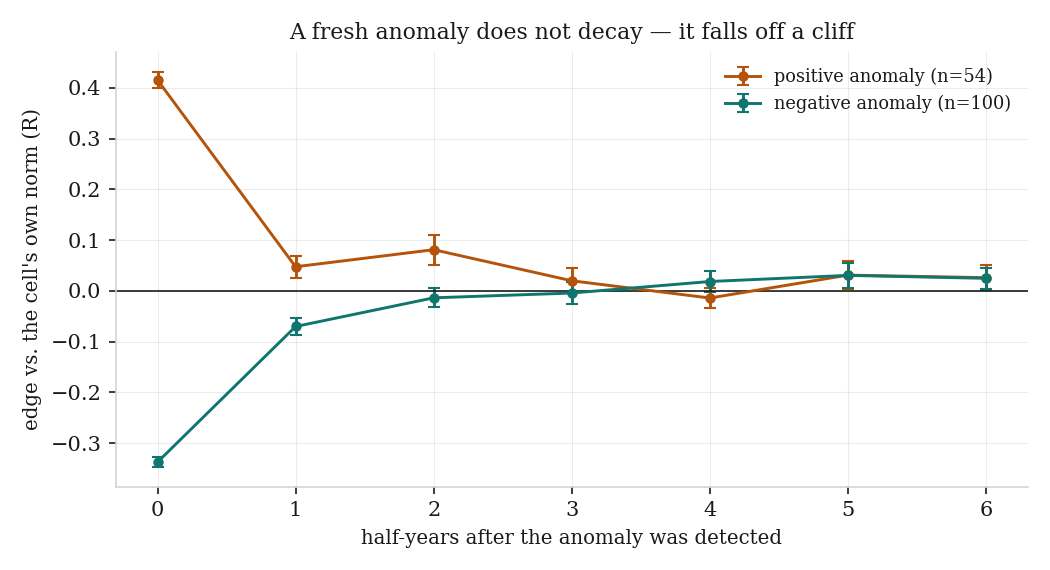
123,193 trades across 10 markets and 11.4 years, split into structural edge, market regime and fresh anomaly. The structural edge carries over five years (β=0.90). A fresh anomaly loses 89% of its size in a single half-year. The past is a forecast — just not the part everyone watches.

MeasuredMarket mechanics · 5 min read

After the EU Close: How Often Does a US Sell-Off Actually Turn Around?

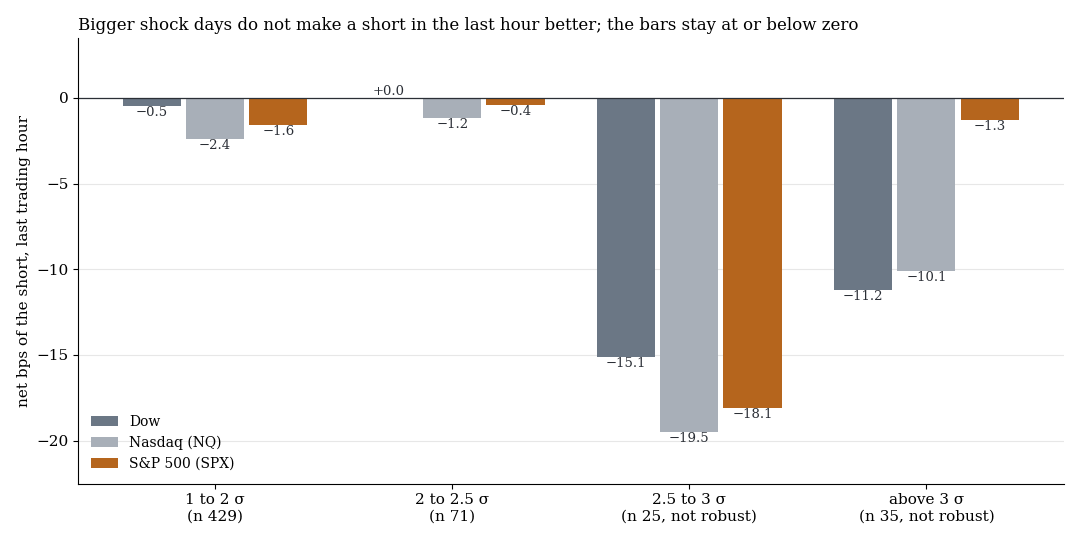
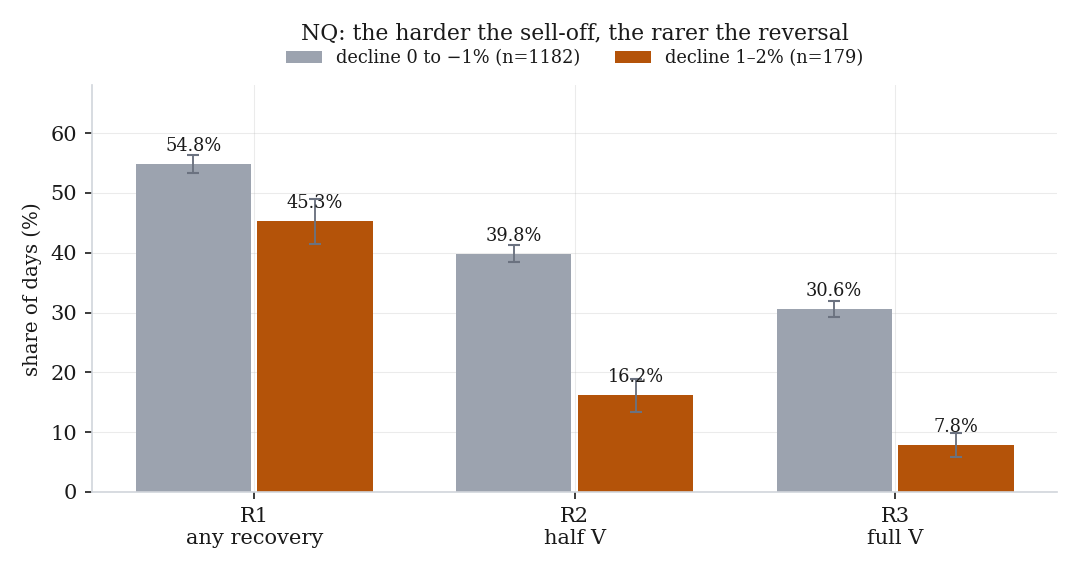
Europe closes at 11:30 New York while the US session runs four and a half hours longer. When the NQ is down 1–2% by then, a full V-reversal follows on just 7.8% of days — and the harder the sell-off, the rarer the reversal, not the more likely.

No edgeMarkets compared · 7 min read

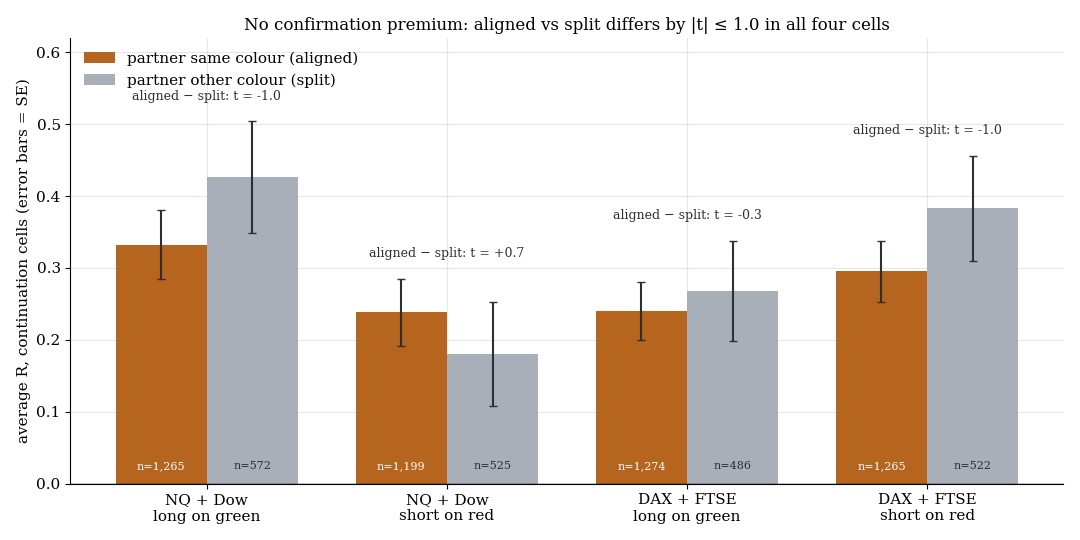
When DAX and FTSE Show the Same Candle Colour — Is the Break Stronger?

Two indices of the same pair — DAX and FTSE, Nasdaq and Dow — show the same pre-open reference candle colour on 70% of days. The obvious hope: colour agreement as confirmation, a colour split as a warning. Across 7,108 continuation episodes the aligned-minus-split difference sits at |t| ≤ 1.0 in all four cells, with point estimates leaning towards split. The partner candle is redundant information — the third failure of cross-market conditioning.

No edgeExit mechanics · 9 min read

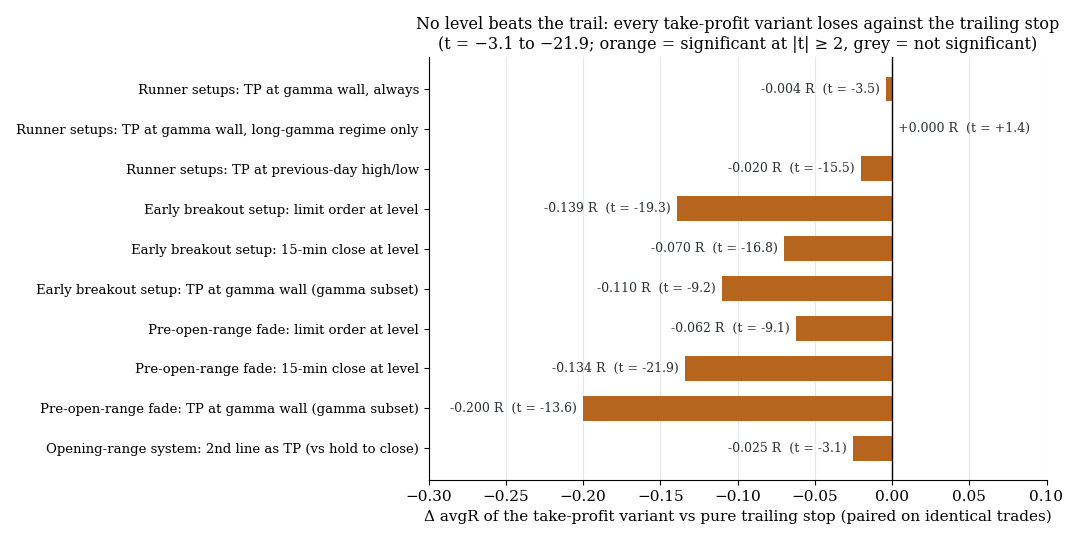
Take-Profit at the Level or Trailing Stop — Where Does the Early Exit Pay?

Gamma wall, previous-day high/low, overnight range, opening-range line: we coded mechanical take-profits at visible levels and paired them against the trailing stop on identical trades. Across four tests the result is uniform: never better, mostly clearly worse (t = −3.1 to −21.9). The reason is the right tail — the 6.6% of trades reaching ≥ 3 R carry the system, and a level TP cuts exactly those.

No edgeCandle patterns · 8 min read

How Strong Is a 1h Pin Bar — and What Does "Activation" Really Do?

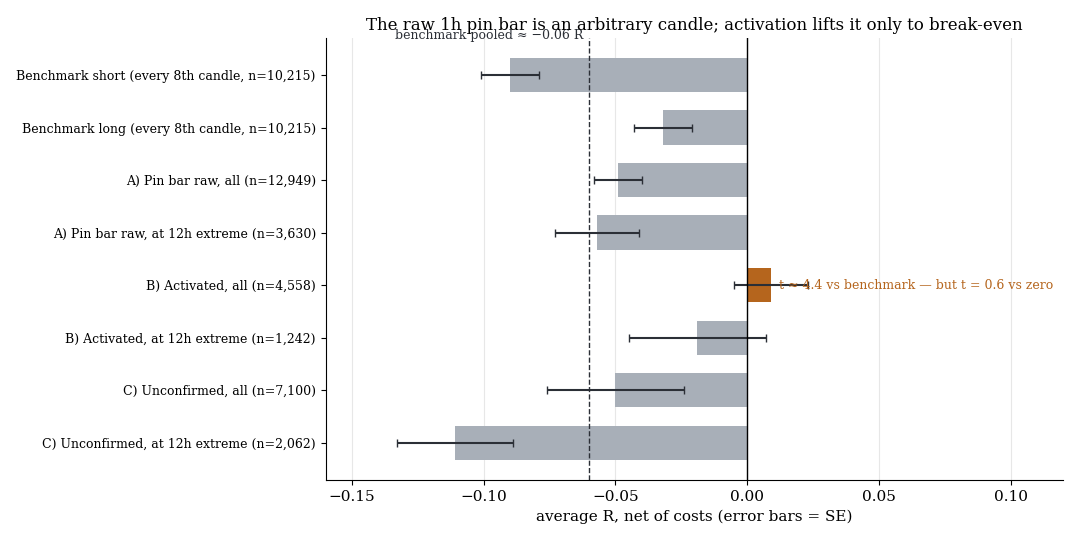
12,949 mechanically defined 1h pin bars on DAX, FTSE, NQ and DOW, traded against the wick: −0.049 R, the same as any arbitrary candle with the same bracket geometry. At the 12h extreme too: −0.057 R. Only the second 1h close beyond the pin extreme lifts the result to +0.009 R (n=4,558, t ≈ 4 against the baseline) — real, but only cost-covering. The reason: activation structurally turns the reversal into a break.

MeasuredRegime & filters · 7 min read

The Fisher Bias: A Useful Day Picture, a Useless Trade Filter

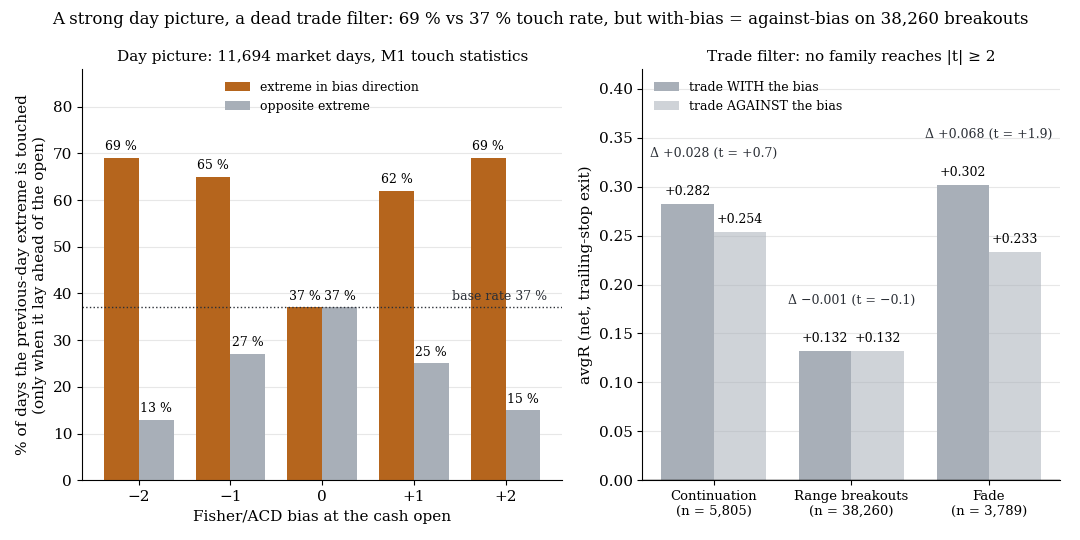
A bias derived from the open relative to the pivot range (Fisher/ACD logic) predicts very well which prior-day extreme the market will reach: at ±2 it is 69% against a 37% base rate. As a trade filter the same bias adds nothing — with vs against Δ = −0.001 R at n = 38,260. Once the extreme is reached the information is spent: 50/50 in every bias state.

No edgeMarkets compared · 8 min read

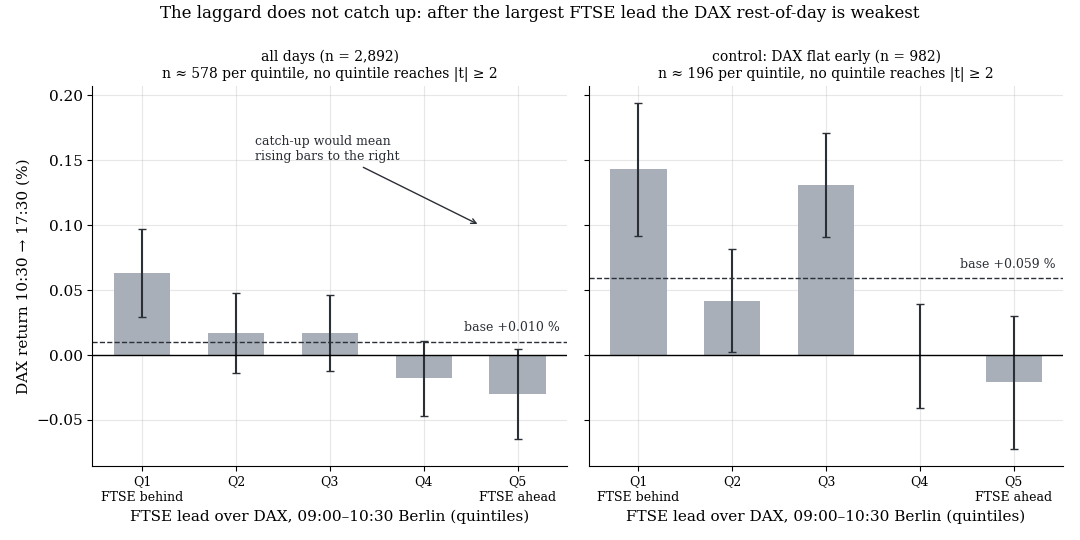
When the FTSE Runs Ahead — Does the DAX Catch Up?

Two European indices, 73% correlation over the first 90 minutes. When one pulls away, the other should follow. Across 2,892 shared trading days it does not: the DAX's rest-of-day return after the largest FTSE lead is −0.030%, after the largest FTSE lag it is +0.063% — the gradient points the wrong way, and no quintile reaches |t| ≥ 2. On a daily basis across five indices there is no catch-up either.

No edgeCandle patterns · 7 min read

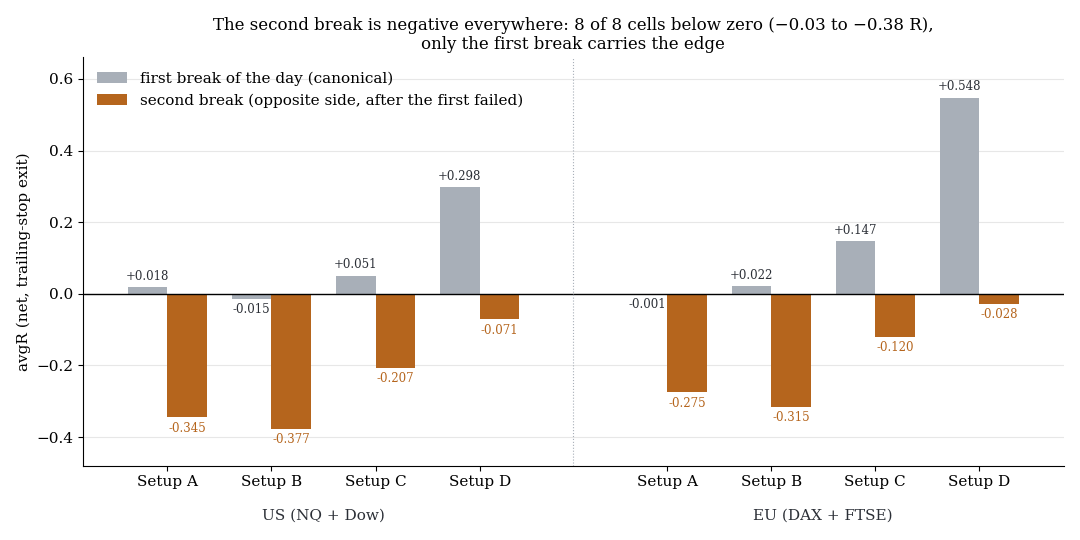
The Second Break Is Negative Everywhere

When a reference range breaks up first and then down, the second break is negative in all four breakout setups and both market groups: US between −0.071 and −0.377 R, EU between −0.028 and −0.315 R. Only the first break carries the edge. Trading both sides flips the US book from +1,949 R to −839 R.

MeasuredCandle patterns · 6 min read

Lock Out the Day After an Early Whipsaw? Late Breakouts Get Better Instead

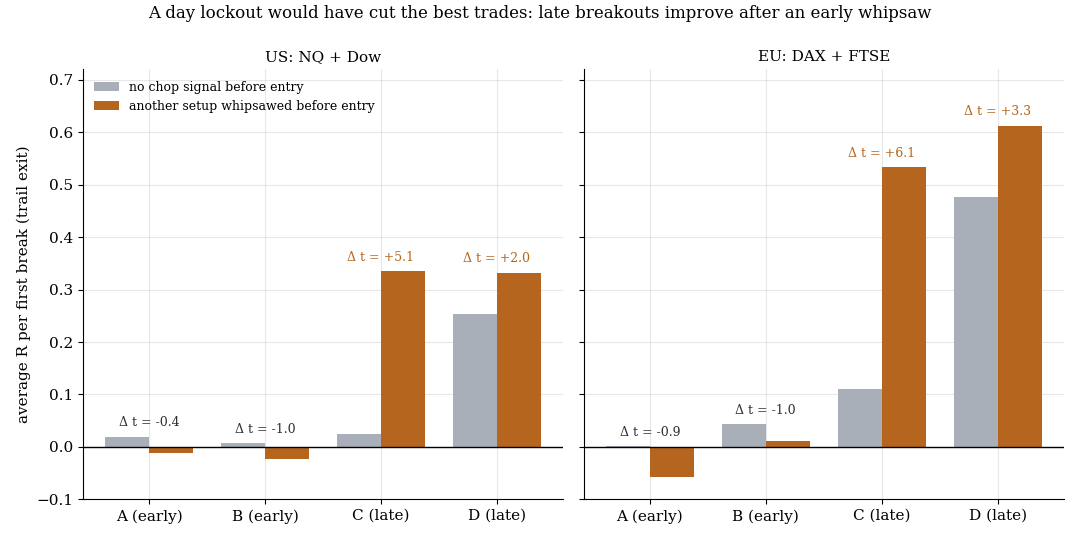
Intuition says: once an early setup has exposed the day as choppy, the later ones should be skipped. Measured, the opposite is true. The late breakout setups of the session run markedly better after an early whipsaw — US +0.024 → +0.335 R (t = +5.1), EU +0.111 → +0.533 R (t = +6.1). A day lockout would have removed exactly the best trades.
No edgeCandle patterns · 8 min read

Fibonacci Zones as a Forecast — Do They Beat a Random Walk?

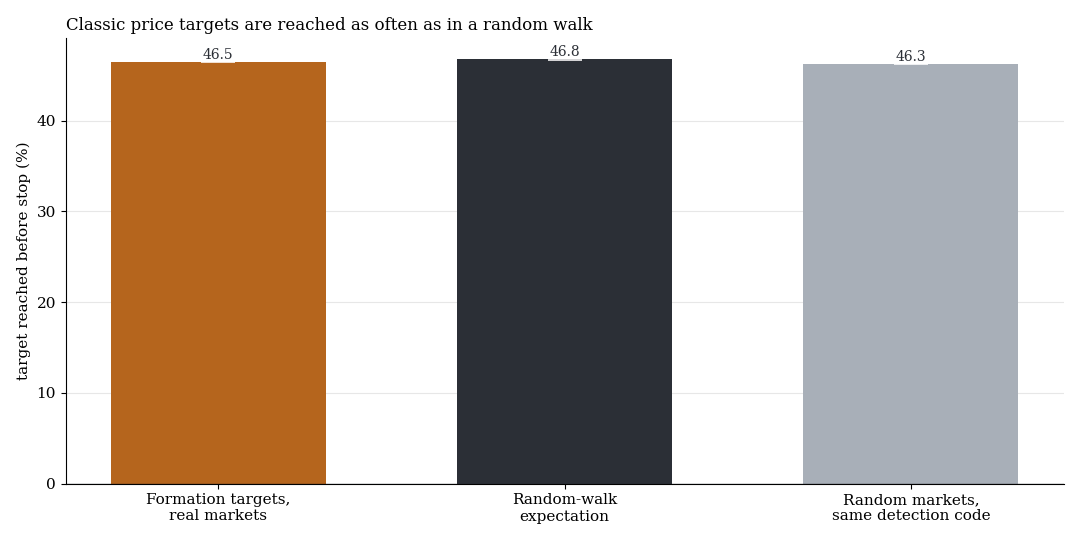
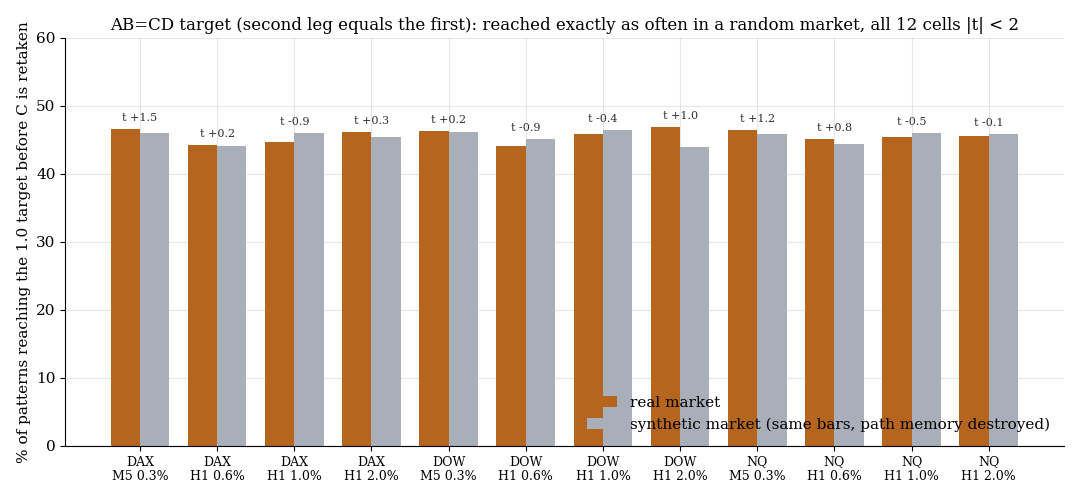
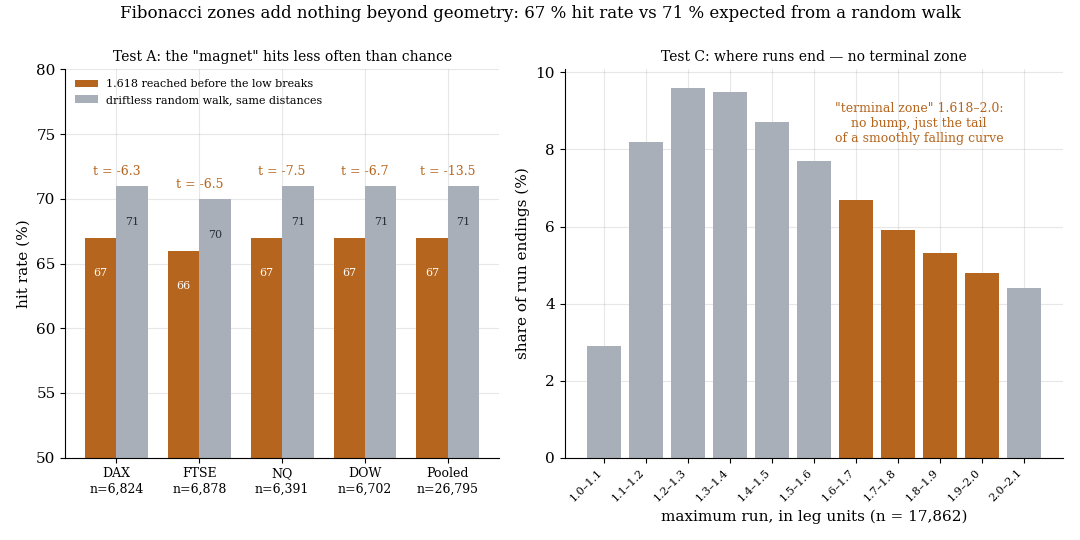
After an activated double bottom, does price reach the 1.618 extension before breaking the low? In 67% of 26,795 sequences on DAX, FTSE, NQ and DOW — a driftless random walk would have done so in 71% (t = −13.5). The 0.5 pullback entry wins 35.5% against a 34.8% random-walk expectation, +0.020 R. And the distribution of where runs end shows no hump in the 1.618–2.0 zone. The zones forecast nothing the geometry does not already dictate.

Dealer gamma · 9 min read

Dealer Gamma in Practice: Why Most GEX Maps Hug the Spot — and How to Separate Structure from Day Weather

Gamma flip, call wall, put wall: nearly every freely available GEX map blends all expirations into one number — and ends up dominated by 0DTE gamma that physically decays during the session. A live decomposition on NQ (2026-06-10): how a call wall 'migrates' 1,300 points intraday without a single position changing, why intraday recomputation is repainting — and how a three-layer model (structure 7–45 DTE, near OI 0–5 DTE, 0DTE volume) nailed the day's high to the point.

Edge confirmedMarket mechanics · 11 min read

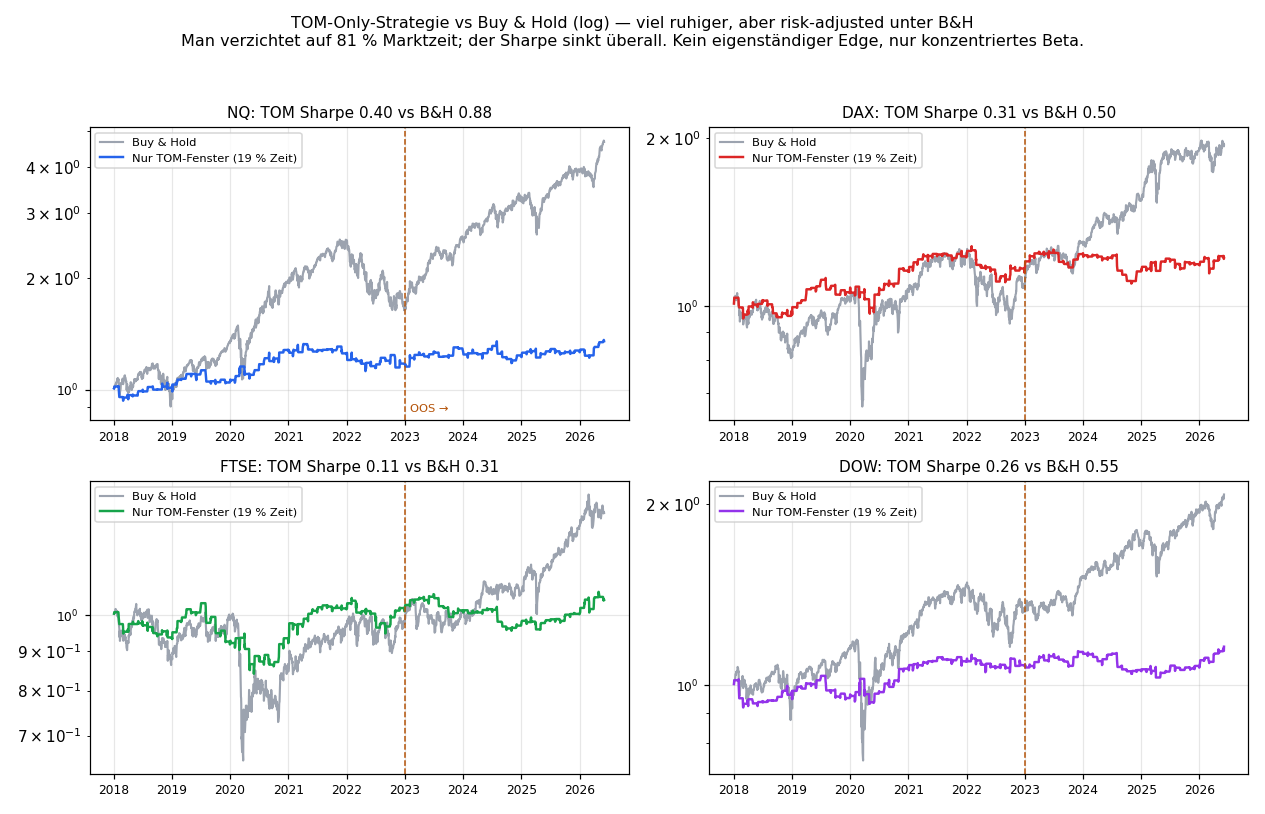
The Turn-of-the-Month Effect: a mechanism edge through the validation gate

The first edge in the series that doesn't come from a price pattern but from a reason: forced participants (inflows, fund rebalancing) around the month boundary. Tested cross-asset (DAX/FTSE/NQ/Dow, 2018–2026, net of costs). The accumulated return concentration collapses under a clean significance test — but the trader frame reveals the actually usable part: EOM days are 4/4-significantly larger movement days (extra movement at open & close), more breakout-friendly on 3/4 markets. A case study on how the measurement frame decides between a find and a null.

ReferenceFrom edge to EA · 9 min read

Methodology: How to Develop a Trading Algorithm Honestly — a Reference Run

The process document for the whole series: the complete workflow from idea to MT5 algo in five phases, illustrated by the cross-asset 2nd-candle run. With the guiding principles that separate real from apparent edges — and why only one market survives in the end.

Edge confirmedFrom edge to EA · 7 min read

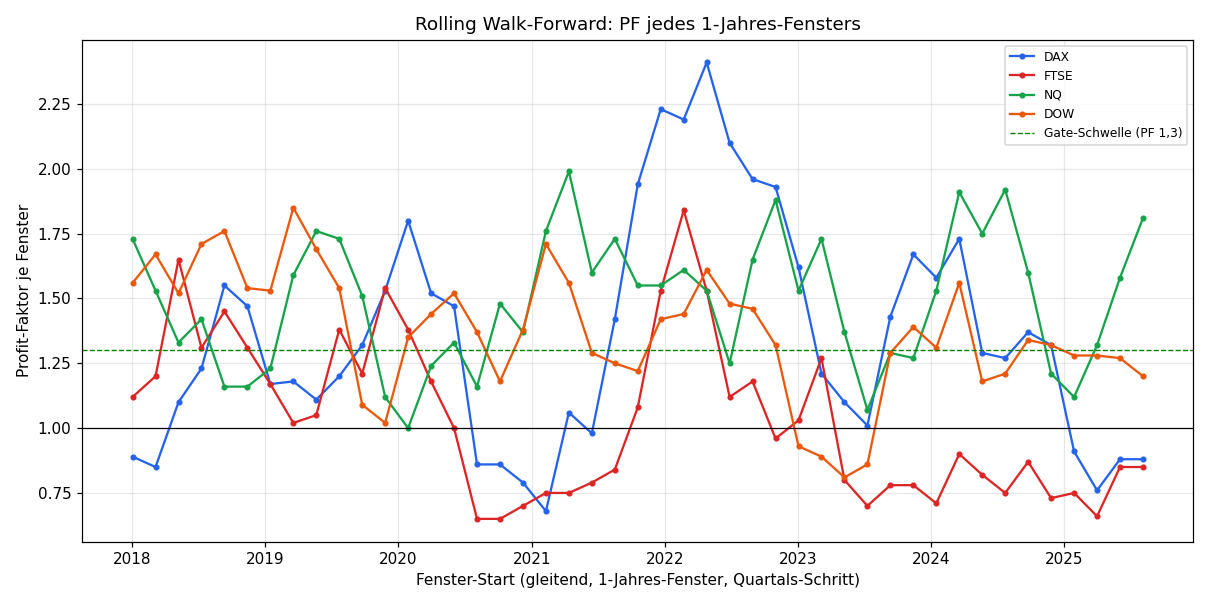
The Validation Gate: Does the 2nd-Candle Edge Survive Out-of-Sample, Walk-Forward & Monte-Carlo?

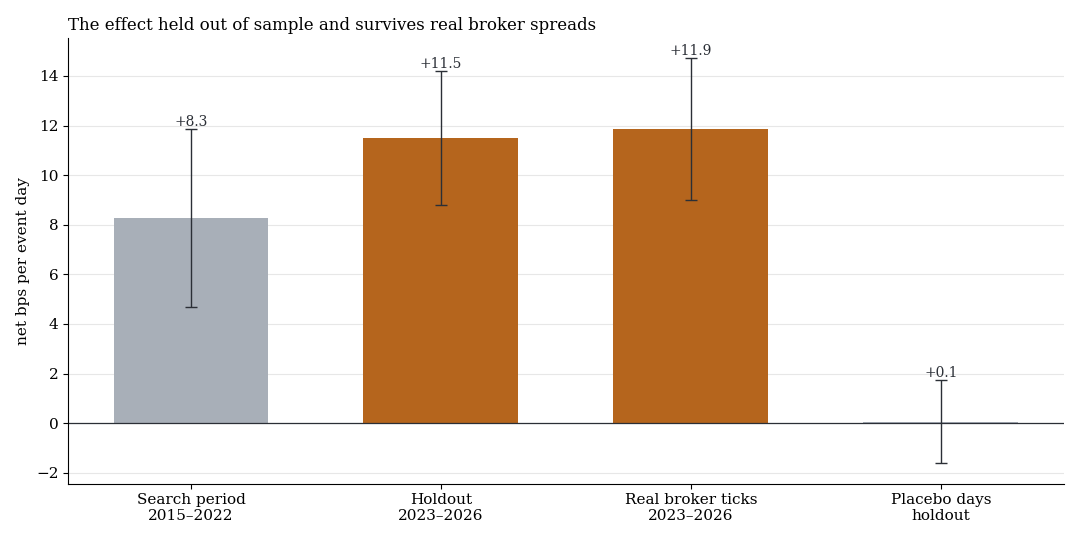
The stress-test paper: out-of-sample split, rolling and anchored walk-forward, Monte-Carlo (shuffle + bootstrap) and deflated Sharpe on the final ruleset. Cross-asset over ~2,090 days per index, net of spread. Only one market passes.

Edge confirmedFrom edge to EA · 5 min read

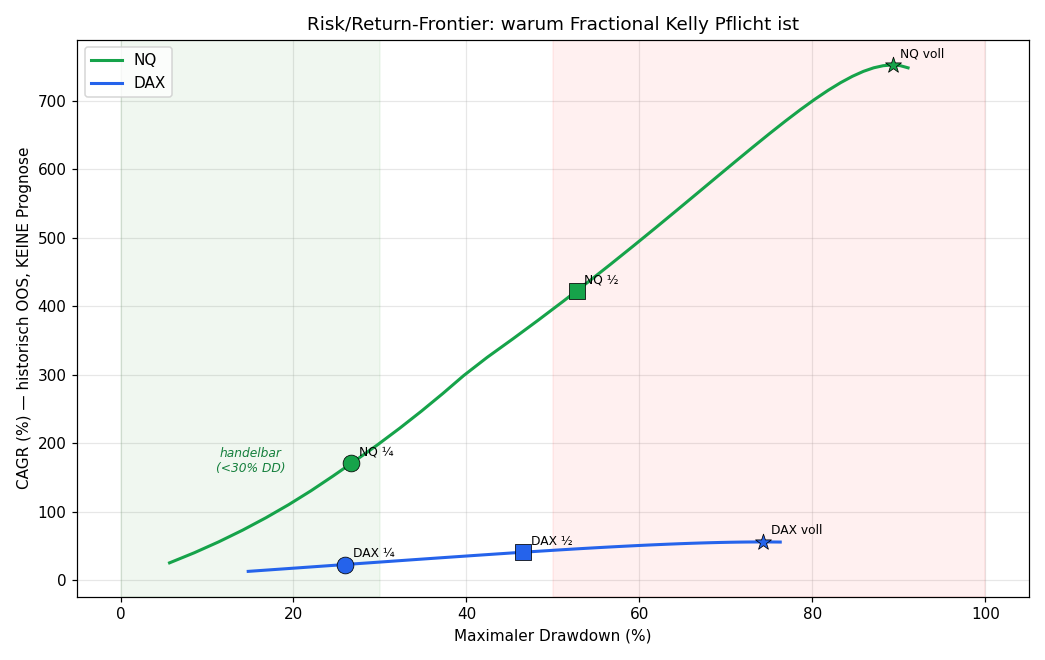
Position Sizing & Kelly: How Much Risk on the Validated Edge?

Phase 4 of algo development — only on the validated core (NQ, DAX). Optimal-f (Kelly), fractional Kelly, vol-targeting and max-DD-stop, computed on out-of-sample parameters. Why full Kelly is suicide and quarter-Kelly the floor.

Edge confirmedFrom edge to EA · 8 min read

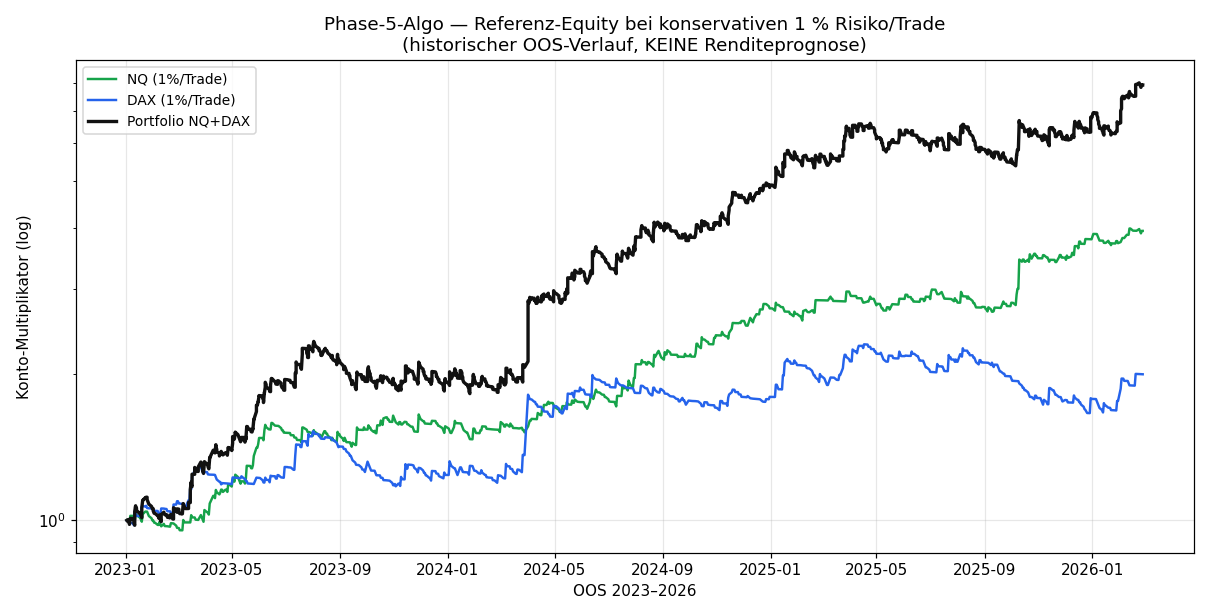
The Finished Algorithm: MT5 Expert Advisor & Reference Backtest

The validated system as a deployable MQL5 algo — plus the real MT5 run against buy-and-hold and the perfect exit. NQ beat buy-and-hold ~2× (through end-2024), DAX is dead. And the most honest chapter: edge perishability — the backtest stayed green while the real account lost from 2025.

Edge confirmedFrom edge to EA · 11 min read

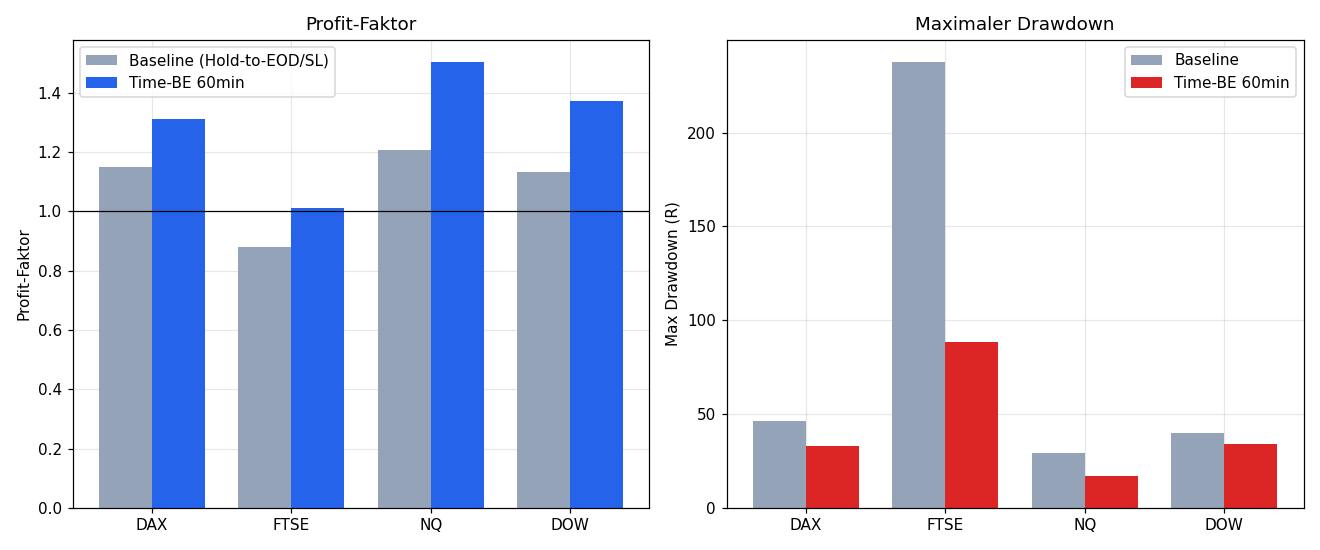
Exit Logic for the 2nd-Candle Breakout: Does Moving the Stop Pay Off?

Trailing, break-even, partials, multi-TP, exit at the Asia/ONR edge — what actually helps? Cross-asset study (DAX, FTSE, Nasdaq, Dow) over ~2,090 days per index, 37 exit variants tested net-of-spread against a reference rule.

MeasuredOpening candle · 5 min read

Trend-Day Detection via the 7th Opening Candle

Does the 7th 15-minute candle (~90 min after open) deliver a tradeable trend signal? A cross-asset study (DAX, FTSE, Nasdaq, Dow) over ~2,090 days per index — directly comparable to the 2nd candle.

Edge confirmedFrom edge to EA · 8 min read

Trend-Day Detection via the 2nd Opening Candle

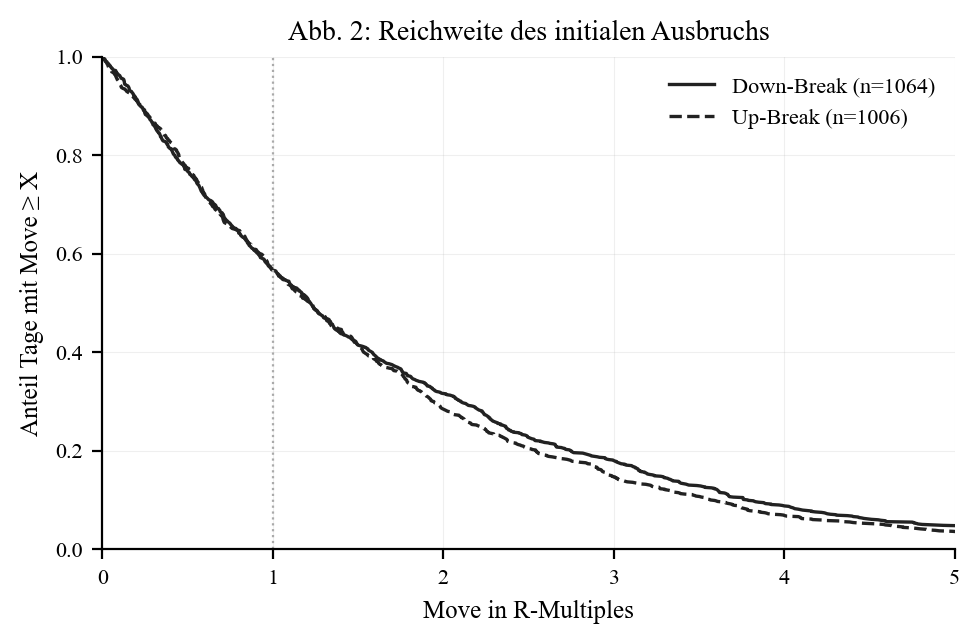
Does the 2nd 15-minute candle after cash open deliver a tradeable trend breakout? A cross-asset study (DAX, FTSE, Nasdaq, Dow) over ~2,090 days per index — tracking the move to the close instead of to the first opposing candle.

MeasuredOpening candle · 4 min read

Reference Candle Break Across Indices — FTSE, Dow & Nasdaq

Does the DAX reference-candle behaviour transfer to other indices? The same methodology applied to FTSE 100, Dow Jones and Nasdaq 100 over ~2,090 trading days per index — the answer is consistent.

MeasuredOpening candle · 7 min read

DAX Pre-Market Reference Candle — Breakout Behaviour After Cash Open

How far does the DAX break out of the 08:50–09:00 reference candle? A statistical study across 2,070 trading days (2018–2026): range, reversal, timing, offset and Asia/overnight sweeps — no strategy recommendation, just the data.

Foundations · 9 min read

AI in Trading: Revolution or Buzzword?

A technical analysis of what machine learning actually delivers in trading – and where the promises don't hold up to reality.

ReferenceFoundations · 17 min read

From Backtest to Live: Scientific Validation of Trading Strategies

How do you distinguish robust strategies from lucky flukes? A deep dive into the methods used by professional quants – from historical origins to modern application.

Open questions

6
  • Planned

    Mechanism edges (forced participants): following the turn-of-the-month template, run options gamma/OPEX, the futures roll and the leveraged-ETF closing auction through the same validation gate.

  • In progress

    Night/Asia session: a dedicated reference-candle report — applying the DAX methodology to 22:00–08:00.

  • Planned

    Hybrid exit: trailing stop up to +1 R, then the counter-candle rule — the one door the mechanical-exit versus trailing comparison left open.

  • Planned

    Discretionary level exits versus the trail: measure from journal data (maximum favourable excursion per trade) whether the hand exit beats what the mechanical rule cannot.

  • Idea

    NQ 15-minute candle since 2021: the only cell of the first-candle test with |t| ≥ 2 — does it hold out-of-sample?

  • Idea

    Cross-asset check: does the 2nd/7th-candle trend pattern hold for crypto and single stocks too?

Missing a topic? Suggest it