Note, 29 September 2026: The R values in this study come from our older backtest chain. On a random market without direction that chain still books positive R, so the absolute levels here are too high, and comparisons within the chain are not proven either. Why, and what we changed: The random market as a ruler.
Re-run, 5 October 2026: The 25 combinations of breakout rule and market from our rulebook have been re-measured on the corrected chain and on real broker ticks. None has an advantage over the random market; after costs the mean is −0.08 R per trade. Positive R levels and comparisons in this study are therefore not proven. All numbers: Our own breakout rules, re-measured.
Data basis: Fade of a pre-market low (a break to the downside is traded long), 5 indices (DAX, FTSE, Nasdaq, Dow, S&P), 2015 – Jun 2026, roughly 200 to 230 trades per market and year. Crowding test on our episode basis (15-minute buckets from entry) with a control group of all other setups in the same market. Close filter on an M1 reconstruction, n = 11,943 and 12,789, anchored against the episode basis. Exit: trailing stop BE 0.5 / TS 1.0 / step 0.5, costs (spread + slippage) at entry and at every additional exit. No trading recommendation.
The suspicion came from live trading, and it sounds reasonable. The fade setup buys when a pre-market low is broken — the bet is that the break was a grab for liquidity rather than the start of a trend. The impression of recent months: the low gets undercut once more after entry, the stop sits exactly there, and then the market turns. If a level is known well enough, it gets cleared. Crowding.
A crowding thesis makes testable predictions, which is precisely why we measured it instead of believing it. If the level is increasingly being swept on purpose, then (1) the adverse excursion against the trade must deepen over the years, (2) the share of trades that hit the stop must rise — and (3) both must happen specifically in this setup. If all setups in the same market deteriorate at the same time, it is market regime, not crowding. Point 3 is the real test.
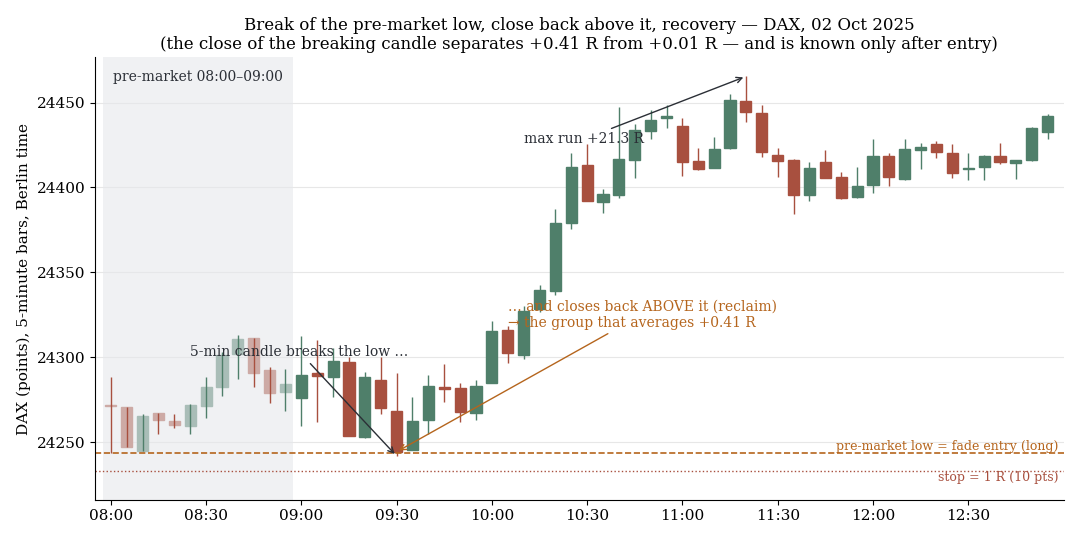
DAX, 5-minute candles: break of the pre-market low, the breaking candle closes back above it, then the recovery. The close separates +0.41 R from +0.01 R but is only known after entry.
1. The stop rate is falling — also relative to the control
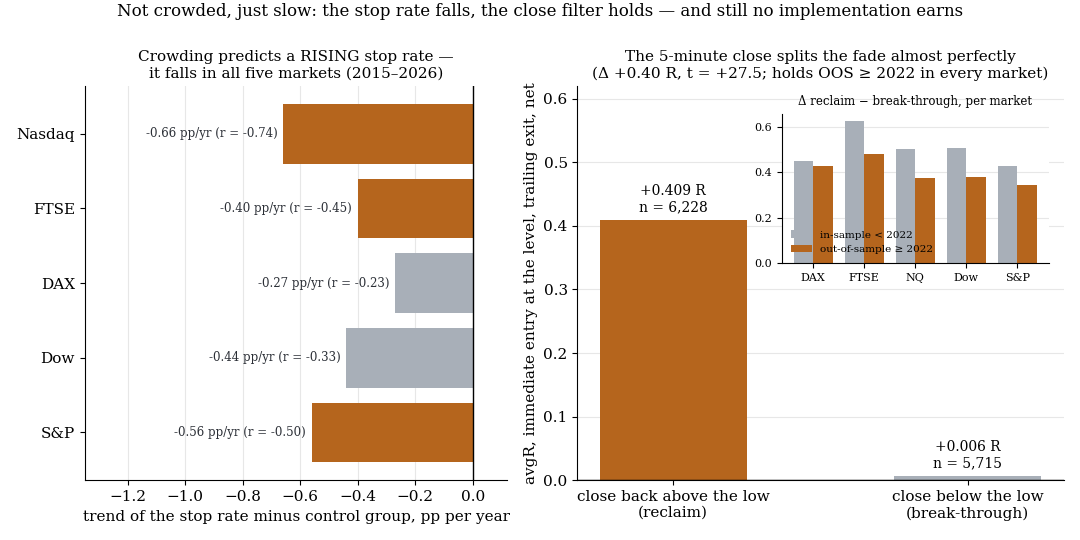
Crowding would predict a rising stop rate; it falls in all five markets. On the right the close filter, which holds in-sample and out-of-sample and still is not tradeable.
For every year and market we measured the share of episodes whose path runs more than 1 R below entry before session end ("stop rate") and the mean maximum adverse excursion (MAE) in R. Both once raw and once as the difference to the control group of all other setups in the same market in the same year. Shown is the linear trend across twelve yearly samples.
| Market | Stop rate raw, trend/yr | Stop rate minus control, trend/yr | MAE minus control, trend/yr |
|---|---|---|---|
| Nasdaq | −0.53 pp (r = −0.66) | −0.66 pp (r = −0.74) | +0.032 R (r = +0.36) |
| FTSE | −0.37 pp (r = −0.38) | −0.40 pp (r = −0.45) | +0.067 R (r = +0.73) |
| DAX | −0.11 pp (r = −0.10) | −0.27 pp (r = −0.23) | +0.034 R (r = +0.43) |
| Dow | −0.27 pp (r = −0.21) | −0.44 pp (r = −0.33) | +0.024 R (r = +0.24) |
| S&P | −0.36 pp (r = −0.35) | −0.56 pp (r = −0.50) | +0.002 R (r = +0.02) |
Nasdaq and FTSE were the markets where the suspicion was strongest. On Nasdaq the stop rate falls by a good half a percentage point per year, relative to the control group by two thirds of a point. Up to 2020 it stood at 80.5%, from 2023 onward at 76.4%. On FTSE the adverse excursion becomes shallower relative to the control every year (+0.067 R/yr, r = +0.73); the MAE difference to the control rose from +0.13 R up to 2020 to +0.61 R from 2023. In all five markets the trend of the relative stop rate points down. Not a single element of the crowding prediction materialises.
Returns do not fit the thesis either. Nasdaq delivered −0.214 R per trade in 2015, −0.001 in 2016, −0.146 in 2017; from 2023 onward it shows +0.491, +0.246, +0.243 and +0.438 R. The setup used to be bad and is good now — the exact opposite of an edge being eaten by imitators.
2. Where the feeling comes from anyway
The setup has a structurally brutal adverse excursion. Over the full episode path to session end, 75 to 85% of all trades at some point run more than 1 R below entry; the mean MAE is −3 to −4 R. Anyone watching that every morning has a sweep experience — it was just more frequent in 2015 than it is today.
And it is not a fast liquidity grab. We measured in which 15-minute bucket after entry the low of the day is reached:
| Market | Bucket 0 | Bucket 1 | Bucket 2–3 | Bucket 4+ | Control bucket 0 |
|---|---|---|---|---|---|
| Nasdaq | 18.4% | 10.0% | 11.3% | 60.3% | 22.6% |
| FTSE | 15.1% | 6.7% | 5.8% | 72.3% | 15.4% |
| DAX | 13.7% | 8.0% | 8.6% | 69.6% | 17.2% |
| Dow | 17.9% | 8.8% | 10.5% | 62.7% | 21.3% |
| S&P | 14.5% | 9.2% | 12.1% | 64.2% | 20.8% |
On FTSE the median low of the day arrives, depending on the year, only in bucket 13 to 24, mostly from bucket 18 onward — three to six hours after entry; 72% of the lows come no earlier than an hour later. The share of lows falling in the first quarter hour is at or below the control group level in all five markets. A deliberate sweep should come early and fast. What the data show is a slow downward drift on the days the fade is wrong — an ordinary failed breakout, not a run on stops.
3. The close separates almost perfectly
If the break is not a sweep, is there any signal at all for whether the fade is right? Yes, and it is remarkably sharp: the close of the five-minute candle that breaks the low. If it closes back above the low (reclaim), the break was a slip. If it closes below (break-through), the fade is against the market.
| Immediate entry at the level | Close above the low (reclaim) | Close below the low (break-through) |
|---|---|---|
| avgR | +0.409 (n=6,228) | +0.006 (n=5,715) |
| Share | 52.1% | 47.9% |
Difference +0.402 R, t = +27.5. The separation holds in every market (reclaim between +0.347 and +0.487, break-through between −0.089 and +0.106) and it holds out of sample:
| Market | Difference in-sample (< 2022) | Difference out-of-sample (≥ 2022) |
|---|---|---|
| DAX | +0.450 | +0.426 |
| FTSE | +0.627 | +0.482 |
| Nasdaq | +0.504 | +0.377 |
| Dow | +0.505 | +0.378 |
| S&P | +0.428 | +0.345 |
| Pooled | +0.503 | +0.402 |
A filter that separates at t = +27.5 on n = 11,943 and keeps sign and magnitude in all five markets in the OOS window is a rare thing. The next question is the decisive one: can you do anything with it?
4. Four implementations — all lose
The filter is only known after entry; the fade enters at the level, the close arrives minutes later. There are four ways to use it anyway. All computed with costs, identical code, IS/OOS split at 2022.
| Variant | Per R of risk deployed | t | In-sample | Out-of-sample |
|---|---|---|---|---|
| Base (enter immediately, trail to session end) | +0.169 | +22.8 | +0.109 | +0.264 |
| Exit at the close on break-through | −0.186 | −23.0 | −0.243 | −0.096 |
| Additional position at the close on reclaim | +0.090 | +13.5 | +0.062 | +0.246 |
| Both combined | −0.149 | −21.5 | −0.290 | −0.115 |
| Wait for the close, then enter | −0.153 (t = −17.8), difference to base −0.369 (t = −37.6) |
n = 12,789 for the first four rows, 11,943 for the waiting variant. The result is the same in all five markets: the exit is negative everywhere (−0.143 to −0.228), the additional position is below the base everywhere (+0.055 to +0.151 against +0.104 to +0.251).
Why the exit loses: break-through trades stand at −0.751 R on average at the close of the breaking candle. Left to run with the trailing stop, they end at −0.058 R on average. The exit realises the interim loss and cuts off exactly the recovery that makes up this group's zero result. Why the additional position loses: it buys higher after the reclaim with the same structural stop, so it has a worse reward-to-risk ratio; the add-on leg on its own returns −0.073 R. Why waiting loses: the entry price is gone — the candle that closes back above the low already has the best part of the move behind it.
5. What this means
The crowding thesis is refuted. Not weakened, not "unclear" — all three predictions point the other way, in both suspect markets and in the three control markets. The setup is better in 2023 to 2026 than ever before. The sweep impression arises from a property the setup always had: it tolerates deep adverse excursions and lives off the right tail.
A perfect filter is not the same as a tradeable filter. That is the real lesson of this study. The close separates +0.41 from +0.01 R, and yet every implementation costs money because the filter arrives too late: it is only known once the entry price is gone. We have now seen this pattern for the sixth time — after level take-profit, reclaim rules, second break, chop lockout and anti-trade: every mechanical early exit cuts into the tail the system lives on. The results are consistent with the exit study and with the comparison of mechanical exit versus trailing stop. The setup stays unchanged.
What the feeling was: recency. A setup with 75 to 85% of paths running below −1 R feels swept in every bad week. The number that tests it is the stop rate relative to the control across twelve years — and that is falling.
6. Limits
- Yearly samples are small (80 to 230 trades per market and year). Individual years are not robust; only the trend across all years and its consistency across five markets is.
- MAE in R depends on the reference range. If the pre-market candle becomes relatively narrower, MAE in R grows without the market behaving differently. The control group only partly absorbs this; hence the emphasis on the stop rate relative to the control.
- The close variants are an M1 reconstruction, not the episode basis itself. The base variant is known to sit +0.03 to +0.09 R above the basis (finer trailing); the comparison of variants runs through identical code and is unaffected, absolute values are order-of-magnitude only.
- Five-minute candles on a fixed grid, no slippage surcharge for stress moments at the close exit.
- Open: on FTSE the yearly avgR declines (+0.149 in 2015 against +0.060 in 2025) while MAE improves relatively. The suspicion is a growing cost share with a smaller reference range (0.199 → 0.163% at unchanged spread) — not tested.
- Not tested: a hybrid rule that activates the break-through exit only after a minimum holding time, and the filter on timeframes other than M5.
📄 Full study as PDF: 7 pages incl. all tables, figures and limits (in German).
Disclaimer: Historical statistics are no guarantee of future market behaviour. This study is not investment advice. Trading involves risk of loss up to total loss.