Note, 29 September 2026: The R values in this study come from our older backtest chain. On a random market without direction that chain still books positive R, so the absolute levels here are too high, and comparisons within the chain are not proven either. Why, and what we changed: The random market as a ruler.
Re-run, 5 October 2026: The 25 combinations of breakout rule and market from our rulebook have been re-measured on the corrected chain and on real broker ticks. None has an advantage over the random market; after costs the mean is −0.08 R per trade. Positive R levels and comparisons in this study are therefore not proven. For the comparison of exits this means: the trailing stop of the old chain was calculated too favourably. On the corrected chain, simply holding until the end of the session does better than the trailing stop in 18 of 25 combinations, none of them significantly positive. The ranking of exits in this study is therefore open. All numbers: Our own breakout rules, re-measured.
Data basis: Three setup families on our episode basis — day-session runner setups on NQ and Dow with gamma data from 2021 (n = 10,867), an early breakout setup after the cash open (n = 6,833) and a fade setup at the pre-open range (n = 4,468) — plus an opening-range reconstruction of the public ACD system on M1 data (DAX, FTSE, Dow, NQ, SPX, 2015–2026, n = 12,460 entries). All comparisons are paired on identical episodes; the stop is checked intrabar before the take-profit (pessimistic for the TP variants). Baseline: trailing stop BE 0.5 / TS 1.0 / step 0.5. Entry net of spread and slippage. All levels are known at entry (previous-day data, overnight range, opening range) — no lookahead. Measured June/July 2026, reproduced September 2026. No trading recommendation.
Anyone who trades discretionarily knows the observation: price runs to the gamma wall and turns. It runs to the previous day's high and turns. It reaches the second line of an opening-range system and turns. The conclusion suggests itself — take the profit at the level before the trailing stop gives part of it back.
We coded exactly that as a rule and put it against our standard exit. Not the question "do prices turn at levels?", but the only one that matters: does a trade earn more when closed at the level than when the trailing stop keeps running? Four tests, three level families, two regions. The answer is uniform.
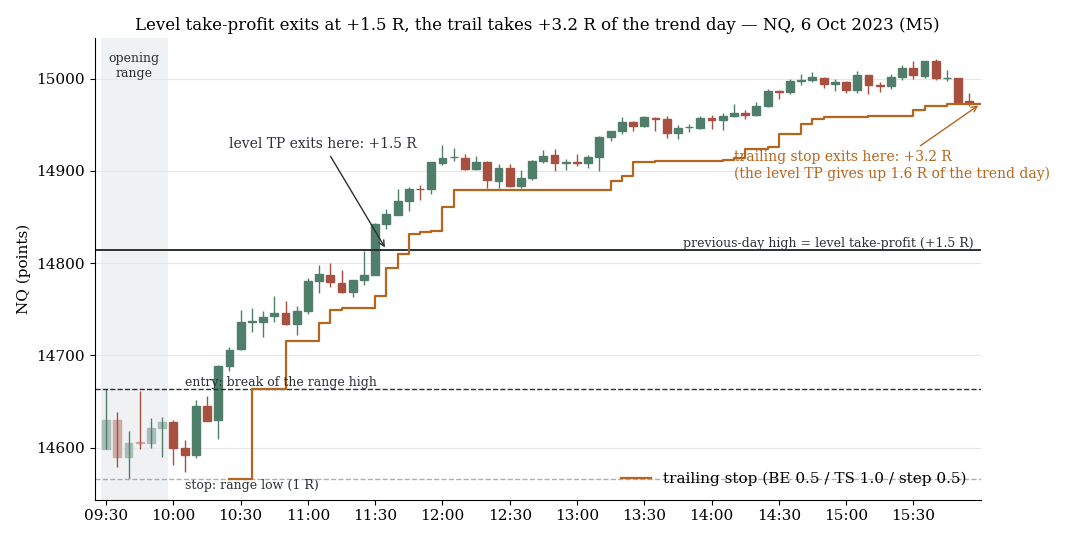
NQ, 5-minute candles: the previous-day high as take-profit exits at +1.5 R, the trailing stop takes +3.2 R of the trend day. The level TP gives up exactly the tail the system lives on.
1. Runner setups: take-profit at the gamma wall
Runners are our setups designed to ride a trend through the day. Tested on US episodes (NQ, Dow) with an available gamma wall in trade direction; TP applied only when the wall sat between 0.5 R and 20 R away.
| Variant | avgR | Share ≥ 3 R | Δ vs trail |
|---|---|---|---|
| Trailing only | +0.105 | 2.1% | — |
| Trail + TP at the wall, always | +0.101 | 2.0% | −0.004 (t = −3.5) |
| Trail + TP only in the long-gamma regime | +0.105 | 2.1% | +0.000 (t = +1.4) |
The effect is small but cleanly negative. The diagnosis by regime explains why: in short gamma (n = 4,756, cascade days) the wall TP costs −0.009 R (t = −3.6) — walls break there, and whoever exits gives up the trend day. In long gamma (n = 723) it is neutral (+0.002 R, t = +1.4). Even where the wall "holds", the TP earns nothing. In the runner subset with the fattest tail (n = 2,645, share ≥ 3 R 5.2%) the wall TP is negative as well: −0.007 R (t = −2.6).
A second runner test using the previous-day high/low as target came out more clearly: −0.020 R (t = −15.5, n ≈ 45,000; measured July 2026).
2. The early breakout setup: the hand trader's targets as a rule
The first hypothesis after the runner result was an excuse: runners live beyond the levels, an early breakout setup after the cash open lives in front of them — there the level TP should help. We wrote that prediction down before testing. Targets exactly as they are drawn in discretionary trading: edge of the overnight range (previous cash close to today's cash open) and previous-day high/low. Two executions: (B) limit order at the level; (C) exit at the close of the 15-minute candle that reaches the level — so momentum may run through the level.
| Setup | Trailing | Limit at level | Candle close at level |
|---|---|---|---|
| Early breakout setup (n = 6,833) | +0.267 (≥ 3 R: 6.6%) | +0.127 (3.6%), Δ −0.139 (t = −19.3) | +0.197 (5.6%), Δ −0.070 (t = −16.8) |
| Fade setup, pre-open range (n = 4,468) | +0.279 (1.7%) | +0.217 (0.4%), Δ −0.062 (t = −9.1) | +0.144 (1.1%), Δ −0.134 (t = −21.9) |
The prediction was wrong, and not narrowly. The setup the level TP was supposed to help loses the most — more than half of its expectancy under the limit variant. The candle-close execution recovers part of it but stays well behind the pure trail. For the fade setup the order of the two executions flips; the result against the trail does not.
With the gamma wall as an additional target (subset with gamma data): breakout n = 1,567, trail +0.411 (≥ 3 R: 10.8%) vs +0.301 with wall TP (8.6%, t = −9.2); fade n = 1,095, +0.395 vs +0.195 (t = −13.6).
3. Opening-range system: the second line as target
Third test, different foundation. We reconstructed the publicly documented ACD system per day: opening range = first 30 minutes after the cash open, entry on the first break of the first line (edge + stretch), stop at the opposite edge, second line at 2.5 × stretch as target. For every entry we compare the exit at the second line against holding to the cash close and against fixed 1 R and 2 R targets.
| Exit | avgR (n = 12,460) | Δ vs "line as TP" |
|---|---|---|
| Second line as TP | −0.046 | — |
| Hold to cash close | −0.021 | +0.025 (t = +3.1) |
| Fixed 2 R target | −0.028 | +0.018 (t = +2.5) |
| Fixed 1 R target | −0.037 | +0.009 (t = +1.6) |
The second line is reached in 69.5% of entries — so the level is hit often. That is precisely the trap: hit rate at a level says nothing about expectancy. By market (line TP minus hold): DAX −0.053 (t = −2.5, n = 2,434), SPX −0.040 (t = −2.3, n = 2,782), NQ −0.032 (t = −2.0, n = 2,548), Dow −0.016 (t = −1.0, n = 2,523), FTSE +0.022 (t = +1.1, n = 2,173). Four of five negative, none significantly positive.
We checked the observation "spikes turn at the second line" separately: for fast approaches (line reached within 15 minutes, n = 2,899) the line TP yields +0.267 against +0.312 for holding (Δ −0.046, t = −1.9); for slow approaches (n = 5,762) +0.281 against +0.312 (Δ −0.031, t = −2.5). Even the spike does not earn more at the level than holding does. One caveat on this test is stated below: the reconstructed system is net negative in our data; only the exit comparison is the statement.
4. Why: the system lives off the right tail
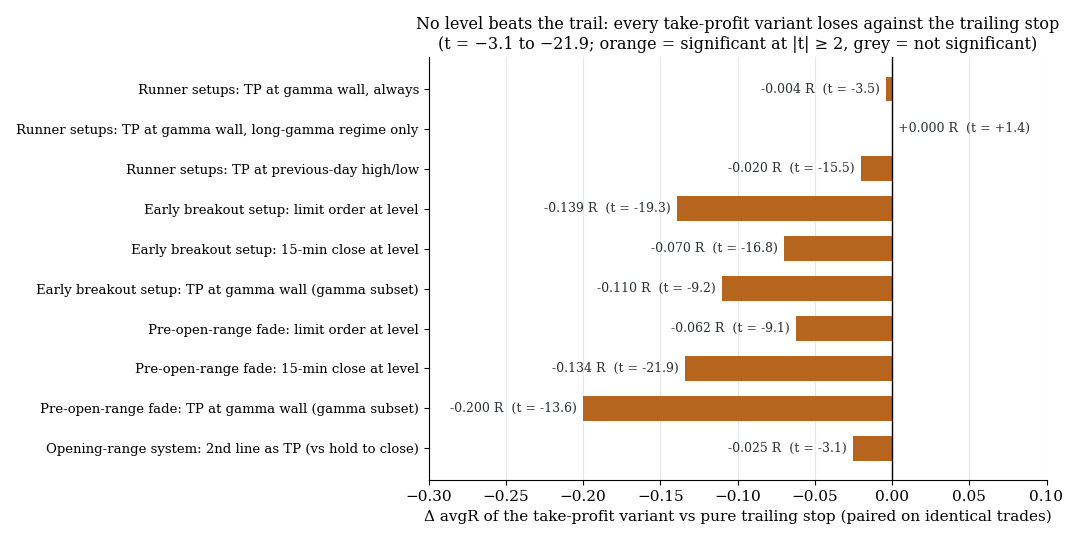
No level beats the trail: every take-profit variant loses against the trailing stop on paired trades, t = −3.1 to −21.9.
The numbers from all three tests show the same mechanism. In the early breakout setup 6.6% of trades reach ≥ 3 R; the limit variant halves that share to 3.6% — and loses 0.14 R per trade doing so. Runners have a thinner tail (2.1%), and the damage is correspondingly smaller (−0.004). In the opening-range system 1.6% of held trades end at ≥ 3 R and 4.5% at ≥ 2 R.
A take-profit exchanges the distribution to the right of the level for a fixed value. That only pays if the expectancy of the remainder beyond the level is negative. Our measurement says it is not — not at the gamma wall, not at the previous-day extreme, not at the overnight range, not at the second ACD line. That prices often turn there is compatible with the result: many small reversals cost the trailing stop little, the few run-throughs earn it a lot. A level respected 70% of the time is a bad exit if the other 30% are the trend days.
5. What this means
No level justifies a mechanical early exit. The finding is uniformly negative across four tests, two regions, three level families and two execution styles; the t-values range from −3.1 to −21.9. It matches our exit study on the second-candle breakout, where 37 exit variants also fell short of the trailing stop.
The "right setup" excuse did not hold. We had predicted the level TP would help the early breakout setup. It hurts there the most. That belongs in the report explicitly — a prediction that fails is more informative than ten that fit.
What remains open is the discretionary exit. What we measured is the dumb rule: every level reached, every trade. A hand trader selects. The bar is the same — "beats the trail" — and it can be checked from journal data (maximum favourable excursion per trade). Until then, the discretionary level exit is an open claim, not a confirmed skill.
6. Limits
- In-sample. No out-of-sample split in the TP tests. The sign is identical across all tests and subsets and the |t| values are large, but the exact deltas are in-sample figures.
- Runner test US only and from 2021 only, because gamma data exists only from then. The gamma levels come from our own pipeline; their data quality is a caveat in its own right.
- Approximation in the candle-close execution: 15-minute candles instead of the 5/10-minute candles used in discretionary trading.
- Opening-range reconstruction in auto mode (stretch = min(SMA10 of daily stretch, 0.3 × OR range)); the whole system is net negative in our data (hold −0.021 R). The test says something about the exit, nothing about the viability of the system.
- Not tested: selective, discretionary level exits; partial profits at the level with the remainder running; levels as entry context instead of exit.
- The setup family is ours. Relative comparisons (exit A vs exit B on the same trades) are robust; absolute avgR levels are optimistic.
📄 Full study as PDF: 7 pages incl. all tables, figures and limits (in German).
Disclaimer: Historical statistics are no guarantee of future market behaviour. This study is not investment advice. Trading involves risk of loss up to total loss.