Data basis: DAX, FTSE 100, Dow and Nasdaq 100. Dukascopy CFD minute data from January 2015 to 6 June 2026 on the corrected backtest chain, plus two random markets as the null reference. Real broker ticks from 1 June 2023 to 29 September 2026 in the strategy tester (100% real ticks). Costs: spread and slippage per market in the minute calculation, the real spread on ticks. Filters: search period 2015–2022, exactly one holdout run for 2023 to June 2026. Not a trading recommendation.
On 29 September 2026 we published that our older backtest chain booked positive results on a market without direction (The random market as a ruler). Since then 24 older studies have carried a note saying that we are re-running the central numbers. That is done. This study shows the result.
We measured the rules as they were configured in our own rulebook at the end of September 2026: breakouts from a reference candle, entry when the candle's high or low breaks, stop at the opposite side, exit through a trailing stop or at the end of the session. That makes 25 combinations of rule and market. Many of these rules originally came from looking through charts by hand. Rules like that easily look better in a backtest than they are.
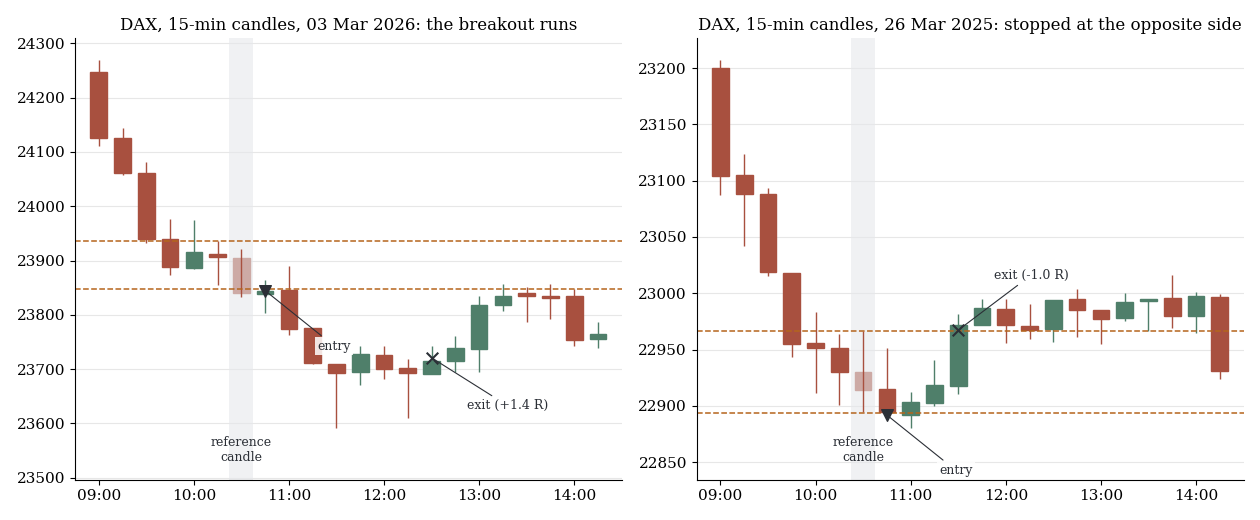
Two real trades of a 15-minute reference candle in the DAX from the tester run on broker ticks. On the left the breakout runs (+1.4 R), on the right it ends at the stop on the opposite side (−1.0 R). Both were drawn at random with a fixed seed from the winning and losing trades, not picked. The dashed lines are the high and low of the reference candle.
1. What we measured
| Rule family | Markets | Trades 2015 to June 2026 |
|---|---|---|
| 15-minute candle shortly after the cash open | DAX, FTSE 100, Dow, Nasdaq | 9,456 |
| later 15-minute candle in the morning | DAX, FTSE 100, Dow, Nasdaq | 4,798 |
| 5-minute candle in the first half hour | DAX, FTSE 100, Dow, Nasdaq | 5,898 |
| 5-minute candle later in the first hour | DAX, FTSE 100, Dow, Nasdaq | 11,102 |
| 15-minute candle around midday | DAX, FTSE 100, Dow, Nasdaq | 11,575 |
| two 10-minute candles around US midday | Nasdaq | 5,871 |
| 10-minute candle before the cash open, breakout in the direction of its close | DAX, Dow, Nasdaq | 6,637 |
Together that is 55,337 trades. All results are in R: 1 R is the distance between entry and stop, the risk of one trade. All values are net, the costs are included in the entry.
2. Old chain against corrected chain
The old chain had three errors that all pushed in the same direction. It filled the entry at the level even when the price was no longer tradable there. It calculated the first minute after the break too favourably. And its trailing stop knew the order of events inside a candle too well. The corrected chain fills like a stop order, follows the price path from the minute of the break and trails the stop only with prices that have already passed.
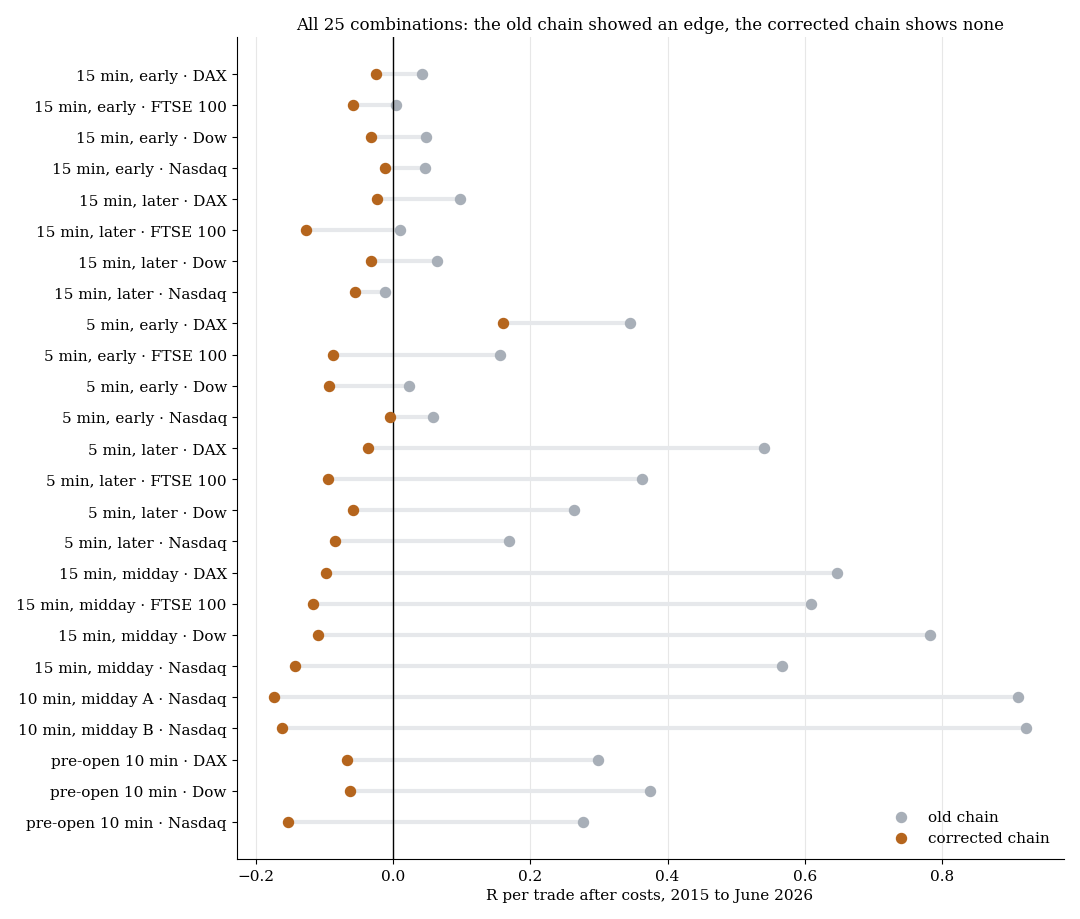
Result per trade after costs for all 25 combinations. Grey: old chain. Orange: corrected chain. The largest phantom profits sat in the midday windows.
| Rule family | old chain (R per trade) | corrected chain (R per trade) |
|---|---|---|
| 15 minutes, early | +0.00 to +0.05 | −0.06 to −0.01 |
| 15 minutes, later | −0.01 to +0.10 | −0.13 to −0.02 |
| 5 minutes, early | +0.02 to +0.35 | −0.09 to +0.16 |
| 5 minutes, later | +0.17 to +0.54 | −0.10 to −0.04 |
| 15 minutes, midday | +0.57 to +0.78 | −0.14 to −0.10 |
| 10 minutes, US midday | +0.91 and +0.92 | −0.17 and −0.16 |
| candle before the open | +0.28 to +0.38 | −0.15 to −0.06 |
On the corrected chain 24 of 25 combinations are negative after costs. The mean over all 55,337 trades is −0.078 R per trade (standard error 0.009). The yearly mean is negative in 10 of 12 calendar years. The only positive combination is the early 5-minute candle in the DAX at +0.161 R. More on that in section 4.
The market did not get worse. The market is the same, the ruler is a different one.
3. The random market as a ruler
A random market is built by mirroring every minute candle at its open with probability ½. The volatility stays, the direction disappears. A clean backtest chain has to lose exactly the costs there on average. The corrected chain almost does: a small residual of +0.036 R on average remains, because the minute that breaks a level often runs a little further even on mirrored candles.
We subtract this residual and call the result the advantage over the random market. The verdict was fixed in advance: an advantage counts only if the value is positive, t reaches at least 2 and both sub-periods are positive.
| Group | Trades | R per trade | Advantage over random market (t) | 2015–2022 | 2023–2026 |
|---|---|---|---|---|---|
| DAX, five reference candles | 10,643 | −0.022 | −0.067 (−2.7) | −0.065 | −0.069 |
| FTSE 100, five reference candles | 10,810 | −0.095 | −0.134 (−5.9) | −0.116 | −0.175 |
| Dow, five reference candles | 10,600 | −0.068 | −0.088 (−4.2) | −0.104 | −0.050 |
| Nasdaq, seven reference candles | 16,647 | −0.104 | −0.134 (−9.1) | −0.158 | −0.077 |
| candle before the open, three markets | 6,637 | −0.095 | −0.153 (−7.0) | −0.191 | −0.065 |
| all 25 combinations | 55,337 | −0.078 | −0.114 (−11.0) | −0.126 | −0.088 |
None of the 25 combinations has an advantage over the random market. 17 are significantly negative, 8 cannot be told apart from the random market.
The rules are not entirely without information. The real market delivers 0.024 R per trade more than the random market on average (t 2.3). The costs average 0.140 R per trade. They are almost six times as large as the information the rules contain.
4. Real broker ticks
Minute data can mislead. So the eight combinations that the minute calculation could not tell apart from the random market, and the three combinations of the candle before the open, also ran in the strategy tester on real broker ticks from 1 June 2023 to 29 September 2026.
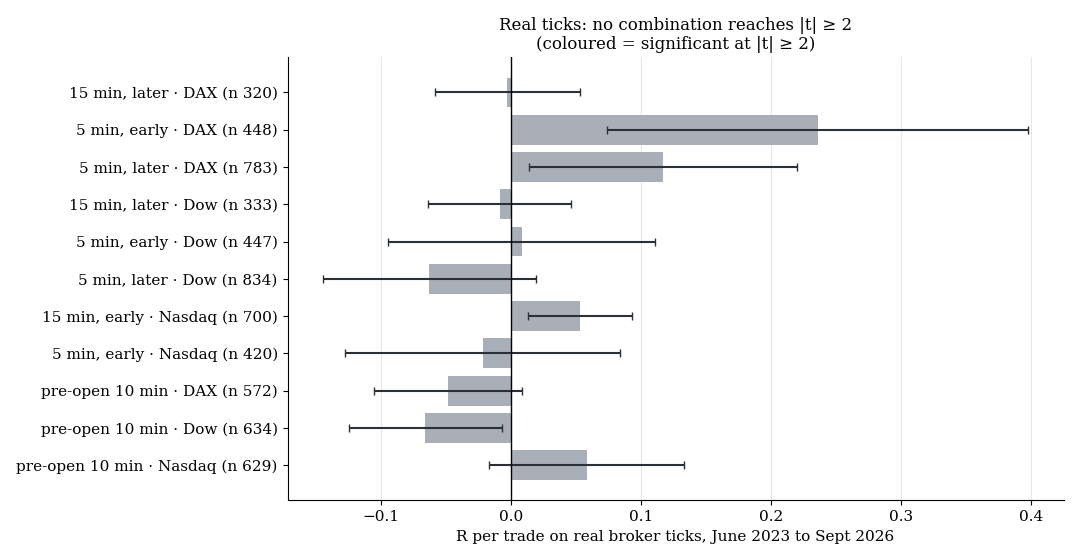
Mean result per trade on real ticks with standard error. A bar would be coloured if it reached t ≥ 2. None does.
| Combination | Trades | R per trade (t) | Profit factor | Years in profit |
|---|---|---|---|---|
| 15 minutes, later · DAX | 320 | −0.003 (−0.04) | 1.01 | 1 of 4 |
| 5 minutes, early · DAX | 448 | +0.236 (+1.46) | 1.24 | 3 of 4 |
| 5 minutes, later · DAX | 783 | +0.117 (+1.14) | 1.11 | 3 of 4 |
| 15 minutes, later · Dow | 333 | −0.009 (−0.16) | 0.97 | 1 of 4 |
| 5 minutes, early · Dow | 447 | +0.008 (+0.08) | 0.99 | 3 of 4 |
| 5 minutes, later · Dow | 834 | −0.063 (−0.77) | 0.91 | 0 of 4 |
| 15 minutes, early · Nasdaq | 700 | +0.053 (+1.33) | 1.15 | 3 of 4 |
| 5 minutes, early · Nasdaq | 420 | −0.022 (−0.21) | 0.96 | 2 of 4 |
| candle before the open · DAX | 572 | −0.049 (−0.85) | 0.91 | 1 of 4 |
| candle before the open · Dow | 634 | −0.066 (−1.13) | 0.89 | 2 of 4 |
| candle before the open · Nasdaq | 629 | +0.058 (+0.78) | 1.08 | 3 of 4 |
No combination reaches t ≥ 2. The eight combinations of the reference candles together come to +0.040 R per trade (t 1.05).
More important than the single numbers is the comparison. The corrected minute calculation matches the tester trade by trade: on 87 to 100% of days both trade the same day, in 96 to 100% of cases in the same direction, and the results per trade correlate at 0.81 to 0.99. On the same days the tester sits 0.006 R above the minute calculation (t 0.56). The residual from section 3 does not show up on real ticks as an additional haircut: the tester was 0.04 R above the chain value on average. For the expectation the chain value without the deduction is therefore the right number, −0.078 R per trade over eleven and a half years. The deduction remains the stricter reading for the question whether a rule can do more than chance.
Several combinations had a good window from 2023 to 2026. Over the whole series since 2015 they are negative. The exception is the early 5-minute candle in the DAX: +0.236 R on real ticks (t 1.46), +0.161 R in the minute calculation since 2015 (t 2.10), +0.144 R in the search period 2015–2022 alone (t 1.61). That is not proof. With 25 combinations tested, a value like this is to be expected by chance.
5. Filters do not rescue anything
The obvious hope: a rule may only work on certain days. Four filters were fixed in advance, all of them known before the entry: the volatility regime, a tight range before the break, the direction of the move before the open, and low dealer gamma. That gave 86 tests in the search period 2015–2022. Six cleared every hurdle, including the cross-check on the random market. Each got exactly one run in the holdout.
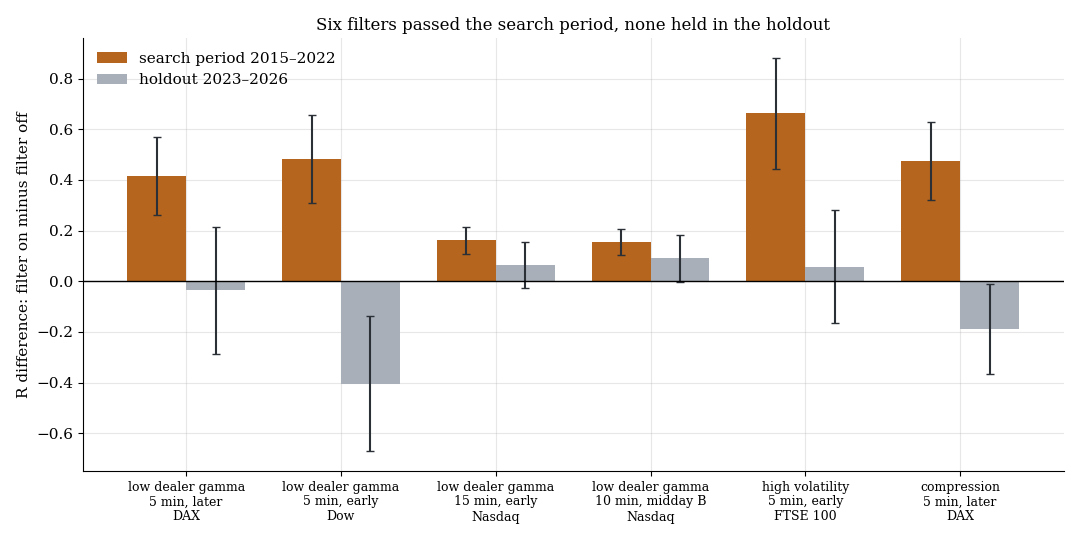
Difference between trades with and without the filter, in R per trade, with standard error. Orange: search period. Grey: holdout.
| Filter | Combination | Search period (t) | Holdout (t) | Verdict |
|---|---|---|---|---|
| low dealer gamma | 5 minutes, later · DAX | +0.417 (+2.7) | −0.036 (−0.1) | rejected |
| low dealer gamma | 5 minutes, early · Dow | +0.482 (+2.8) | −0.404 (−1.5) | rejected |
| low dealer gamma | 15 minutes, early · Nasdaq | +0.161 (+3.0) | +0.065 (+0.7) | not confirmed |
| low dealer gamma | 10 minutes, US midday · Nasdaq | +0.154 (+3.0) | +0.091 (+1.0) | not confirmed |
| high volatility | 5 minutes, early · FTSE 100 | +0.663 (+3.0) | +0.058 (+0.3) | not confirmed |
| tight range before the break | 5 minutes, later · DAX | +0.474 (+3.1) | −0.188 (−1.0) | rejected |
Three filters flip their sign in the holdout, three keep the direction without significance. Part of the filter effect in the search period was itself a calculation artefact: across all combinations the gamma filter showed a difference of +0.130 R (t 5.1), but also +0.053 R on the random market (t 3.2). Days with low gamma have larger candles, and larger candles enlarge the residual from section 3.
One side observation that was not fixed in advance: on the corrected chain, simply holding until the end of the session does better than the trailing stop in 18 of 25 combinations. None of them is significantly positive. The earlier finding that the trailing stop is better everywhere came from the overly favourable stop of the old chain.
What it means
As mechanical rules that run every day, these breakouts do not carry. The rules contain a small, measurable piece of directional information, but the costs are almost six times as large. Whether selecting rules by hand on individual days adds anything is not something this study measures.
For the 24 older studies with the note of 29 September this means: positive R levels and comparisons that rest on the old chain are not proven. Results that do not depend on the chain (price statistics, counts, negative findings without the faulty entry) are not affected. Each of those studies now carries a pointer to this re-run.
The lesson holds for any backtest: run the calculation chain on a market without direction first. Whatever it earns there is not an edge.
Limits
- The minute calculation uses Dukascopy CFD prices (bid) with a fixed cost model per market. Add-on positions, a block on wide spreads and the distance of the trigger from the level are not rebuilt there.
- The tester run covers 3.3 years of a demo data feed. Only the spread counts as a cost there, without commission. The tester knows no queue and no rejected orders.
- The residual on the random market rests on two random markets. For the rules that hold until the end of the session it scatters widely.
- 11 of the 25 combinations ran on real ticks. The other 14 were already significantly negative in the minute calculation.
- Many rules came from looking through charts of exactly this period. That can only flatter the results, it does not touch the negative verdicts.
- Selecting rules by hand per day and position sizing are not part of the measurement.
All pattern families of the scan in the overview. The method is described in The random market as a ruler. Related: night-session breakouts on real ticks and the replication of the opening range breakout.
📄 Full study as PDF: 9 pages incl. all tables, figures and limits (in German).
Disclaimer: Historical statistics are no guarantee of future market behaviour. This study is not investment advice. Trading carries a risk of loss up to total loss.