Data basis: AUS200, HK50, JPN225 and gold as CFDs, overnight session. (1) Dukascopy minute data (BID): search period 2015–2022, separate holdout (a period the search never saw) 2023 to 5 June 2026 with 9 candidates named in advance, exactly one run, fixed spread (difference between buy and sell price) plus slippage (deviation from the intended price). (2) Real broker ticks (Pepperstone demo feed) in the MetaTrader 5 tester, 3 April 2023 to 29 September 2026, 100,000 EUR test account, 0.5% risk per trade, actual spread, no commission. The range jump at the Shanghai open (section 4) uses 2015–2022 only. Benchmark: random market (every minute candle mirrored at its open with probability ½: same volatility, no direction; mean of 8 draws). No trading recommendation.
Seen from Europe, Sydney, Hong Kong and Tokyo trade overnight. A widespread idea says the first quarter hour sets the tone: trade the breakout from an early reference candle and you ride a trend.
The rules come from our own rulebook and arose from looking at charts by hand. Chart reading turns up patterns that need not hold, so we test them like claims from outsiders. The mechanism: an early 15-minute candle after the start of trading is the reference (Australia shortly after the cash open in Sydney, gold in the quarter hour before the Shanghai open at 01:00 UTC). If price breaks above its high or below its low, we enter in the direction of the break, and the stop sits at the opposite side and is trailed. Each market has an early and a later candle, with and without a lockout after the first break (with the lockout, only the first break of the night counts). Two gold variants tied to European clock time bring the total to 18 configurations.
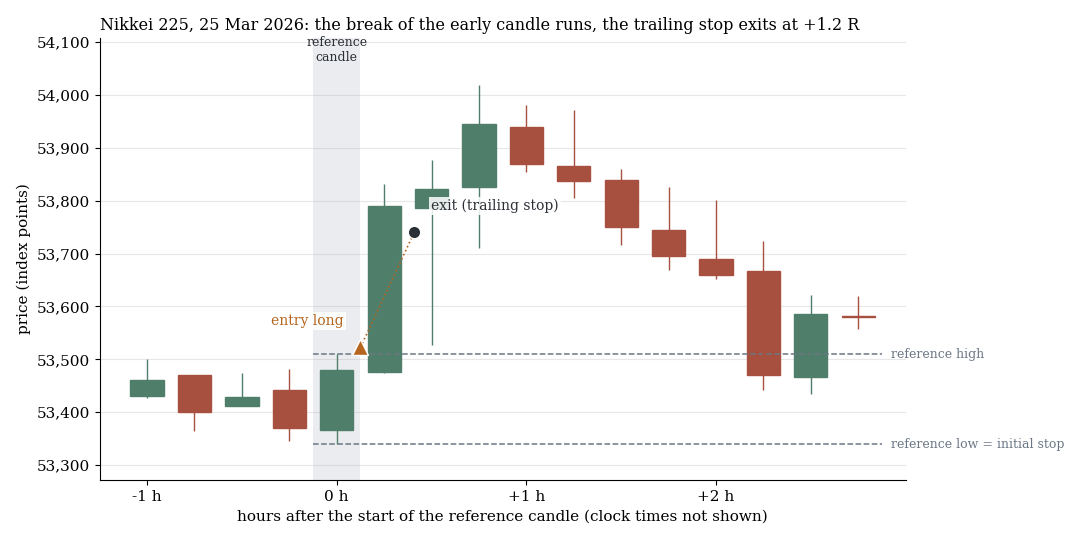
Nikkei 225, 15-minute candles, 25 March 2026. Grey: the reference candle, dashed its high and low. The breakout runs and the trailing stop ends the trade at +1.2 R (R is the result in multiples of the risk per trade). Both examples come from the holdout of the minute calculation and were drawn at random with a fixed seed: one trade of +1 R or more and one trade at the first stop, each from nights with a single position.
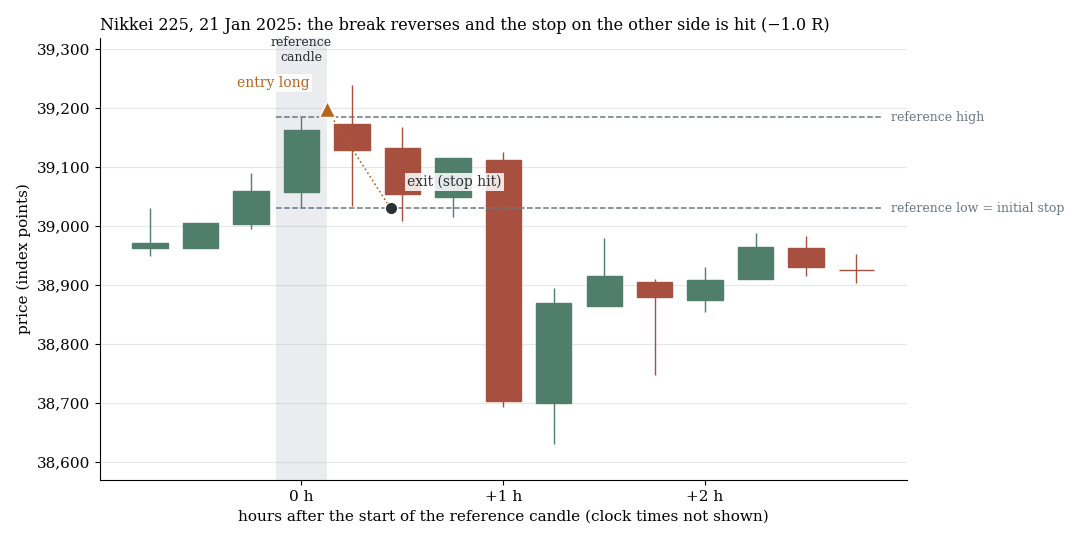
The counterexample of 21 January 2025: the breakout turns within minutes and the stop on the opposite side is hit (−1.0 R).
1. All 18 configurations lose on real ticks
The stricter test runs in the MetaTrader 5 tester with real ticks, real spreads and a trading robot that implements the rules. The spread is paid on every entry.
| Market, candle | Avg R with lockout (t) | Avg R without lockout (t) |
|---|---|---|
| Australia, early | −0.051 (−1.4) | −0.070 (−2.3) |
| Australia, later | −0.069 (−1.8) | −0.093 (−2.9) |
| Hong Kong, early | −0.030 (−0.9) | −0.007 (−0.2) |
| Hong Kong, later | −0.055 (−1.5) | −0.060 (−2.0) |
| Japan, early | −0.042 (−1.1) | −0.037 (−1.3) |
| Japan, later | −0.071 (−2.1) | −0.074 (−2.7) |
| Gold, before the Shanghai open | −0.049 (−1.1) | −0.028 (−0.8) |
| Gold, later candle | −0.063 (−1.7) | −0.045 (−1.5) |
| Gold, fixed European clock time | −0.060 (−1.4) | −0.036 (−1.0) |
No configuration is positive. The profit factor (sum of wins divided by sum of losses) lies between 0.78 and 0.98, and four configurations are significantly negative at t ≤ −2. On the test account the losses range from 5,422 to 44,786 EUR. Summed over the four early configurations with lockout, no calendar year was positive.
2. Zero before the spread, the spread makes the loss
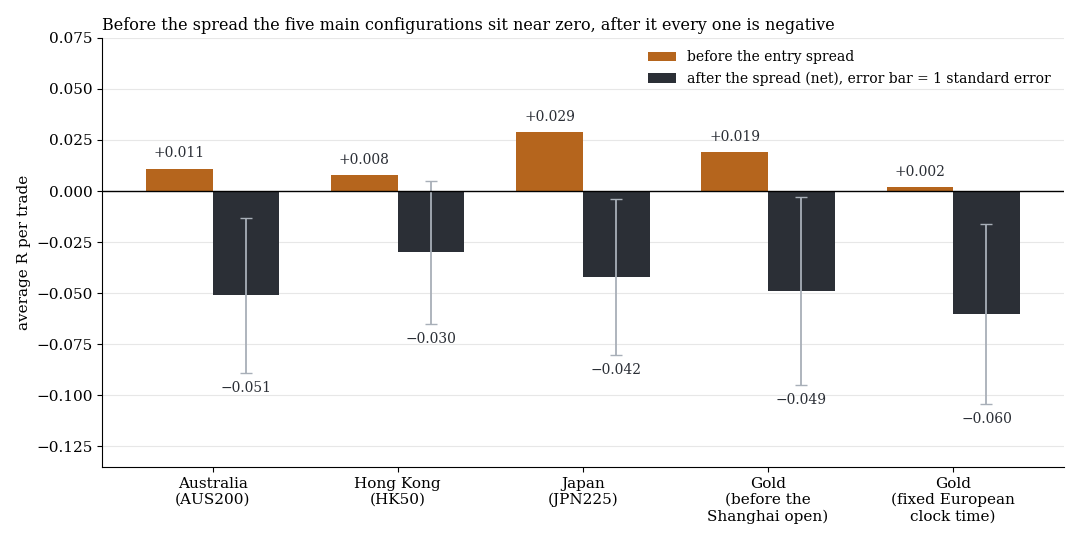
Average R per trade on real ticks, before the entry spread (orange) and after it (dark, with one standard error): early candle with lockout in four markets, plus gold with fixed European clock time.
Before the entry spread, the 18 configurations sit between −0.022 and +0.040 R. The spread costs 0.038 to 0.077 R per trade because the reference candles are small (gold: spread 0.21 USD on average, stop distance 5.4 USD on average). An entry with no information about direction loses exactly these costs. The break of the early candle does not predict the direction of the night. The lockout does not change the verdict.
3. Against the random market: nothing that covers the costs
The second calculation chain replicates the rules on minute data and, for Australia, Hong Kong and Japan, matches the real-tick trades day by day (99 to 100% of trading days, same direction in 96 to 98%). Metrics, candidates and verdict rules were fixed before the first calculation: a rule counts only if net t and the distance to the random market each reach at least 2, the multiple-testing correction (a penalty for having tried many variants) is passed and at least 6 of 8 years are positive. In the search period no configuration meets that. The holdout was then run exactly once:
| Candidate | Holdout R (t) | Random market | real minus random (t) |
|---|---|---|---|
| Australia, early | −0.090 (−2.21) | −0.090 | 0.000 (0.00) |
| Hong Kong, early | −0.033 (−0.92) | −0.086 | +0.053 (1.38) |
| Japan, early | −0.063 (−1.44) | −0.109 | +0.047 (1.01) |
| Gold, before the Shanghai open | −0.161 (−3.52) | −0.113 | −0.048 (−1.00) |
| Australia, later | −0.113 (−2.66) | −0.103 | −0.009 (−0.21) |
| Hong Kong, later | −0.055 (−1.47) | −0.114 | +0.059 (1.46) |
| Gold, fixed European clock time | −0.131 (−2.95) | −0.144 | +0.013 (0.28) |
| Gold early, only after a tight prior range | −0.182 (−2.32) | −0.128 | −0.055 (−0.66) |
| Gold fixed clock time, only after a tight prior range | −0.170 (−2.30) | −0.182 | +0.012 (0.16) |
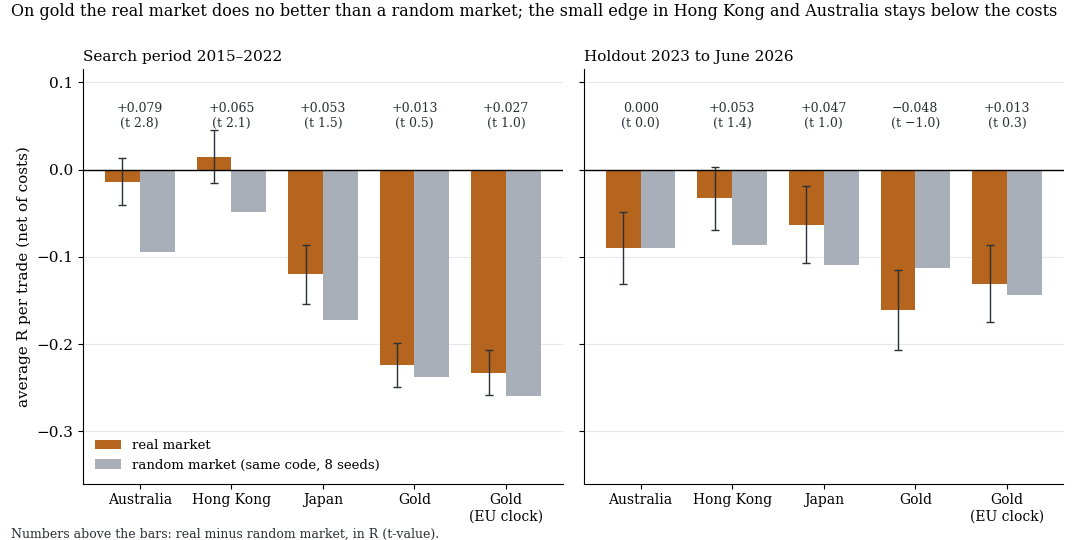
Average R per trade in the minute calculation: real market (orange, with one standard error) against random market (grey), search period 2015–2022 on the left, holdout on the right. Above the bars: real minus random (t).
No candidate is confirmed. Six are significantly negative in the holdout, three are statistically zero, and the global q (the p-value after the multiple-testing correction) is 1.00 throughout. In the search period the early candle in Australia (+0.079 R above the random market, t 2.8) and in Hong Kong (+0.065 R, t 2.1) showed real structure, but net they stood at only −0.02 to +0.02 R. In Australia it vanished in the holdout. Of 48 candles tested (twelve per market), 37 are significantly negative and none is positive.
4. Gold: the range jumps at the Shanghai open, the direction does not
One finding holds. In the ten minutes after the Shanghai Gold Exchange opens at 01:00 UTC, gold's price range is 1.77 times as wide as in the ten minutes before (1,930 Chinese trading days, 2015–2022). On mainland holidays it is 1.09 (132 days, t of the difference 14.2).
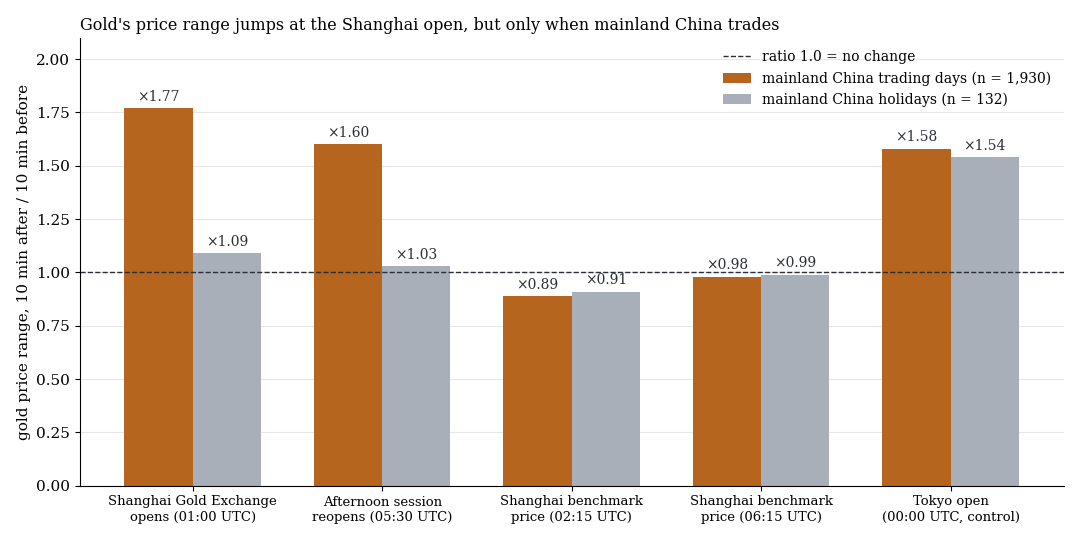
Gold's price range in the 10 minutes after divided by the 10 minutes before the event, 2015–2022. The jump belongs to days when China trades (Tokyo serves as a control).
That does not help with direction. On days without a Shanghai open the rule is just as negative as on other days (−0.224 against −0.219 R in the search period). Even without costs it would stand at only +0.06 R, of which the random market delivers +0.045 R.
The observation “after a tight prior range, Asia expands” came from reviewing charts by hand. We made it measurable in advance (range of the eight hours before the candle in the lowest third of the search period). Result: −0.223 R in the lowest third, −0.226 R in the rest (difference: t 0.07), and −0.182 R in the holdout with the filter instead of −0.161 R without. After a tight prior range, Asia actually runs less far (0.36 instead of 0.40 average daily ranges), and the random market shows the same (0.35 against 0.40). That is volatility clustering, not a pattern.
5. A method finding: the tester only knows today's trading hours
The strategy tester applies a symbol's current trading hours to the whole history. Because the server, Hong Kong and Sydney handle summer and winter time differently, in the other season it rejected entries as “market closed” (232 in Hong Kong, 340 in Australia). The early Australia variant looked harmless at −6,391 EUR (544 trades); with full coverage it is −21,161 EUR (882 trades). We fixed this with a 24-hour symbol built from the same real ticks, whose tick count we checked against the original.
What it means
The overnight breakouts do not carry. Before the spread they are zero, after it they lose, and the random market explains the level. The small real structure, for example in the Hong Kong morning, is the size of the costs. The gold finding shows how easily visible activity gets read as a directional rule: activity is not direction.
Limits
- Data: 3.5 years of real ticks from a demo feed, without commission or delay. The minute calculation uses Dukascopy BID, a fixed spread and an unknown order of events within the minute. Data gaps: Japan before mid-2018, Australia 2015–2017, Hong Kong until 2018.
- Implementation: The real-tick runs measure our implementation in a trading robot, not a pure rule model. Implementation details can move the result by a few hundredths of an R, and a rough upper bound of that effect gives no reliable advantage in any configuration. Variants of the minute calculation (entry one minute later, different trailing, take-profit at 2 R) stay within ±0.04 R.
- Additional position: In 21 to 42% of the real-tick trades a second position of the same night is added. Without it the holdout stays negative (Australia −0.070, Hong Kong −0.027, Japan −0.056, gold −0.134 R).
- Gold without a cross-check: For gold the day-by-day comparison of the two calculation chains is missing. The minute calculation sits lower (holdout −0.161 R against −0.049 R on real ticks, with higher costs per R: 0.17 against 0.068 R), and both are negative.
- Test power: The holdout (3.4 years, 830 to 880 trades per candidate) can neither confirm nor rule out effects below about +0.08 R per trade. 18 configurations are multiple tests, and there is no positive t ≥ 2.
- Range jump in gold: measured on 2015–2022 only. Mainland holidays are weekdays without a Chinese FX fixing (132 days, clustered in Spring Festival and Golden Week).
- Not tested: other exits, entry after a pullback, news days, futures instead of CFDs, real latency.
All pattern families of the scan in the overview. Related: our daily breakout rules re-measured, the random market as a ruler and the reference-candle scan on FX and gold.
📄 Full study as PDF: 9 pages incl. all tables, figures and limits (in German).
Disclaimer: Historical statistics are no guarantee of future market behaviour. This study is not investment advice. Trading carries a risk of loss up to total loss.