Data basis: SPX, NQ, Dow, DAX, FTSE, JPN225, HK50, AUS200 and gold; Dukascopy CFD minute data (BID), plus daily data (S&P 500 since 1990 from Yahoo Finance, bond yields from the US Treasury), ProShares fund data and SEC filings. Search period 2015–2022, separate holdout 2023 to 5 June 2026, which we evaluate only after the search and at most once per rule. Costs per round trip from a fixed model (for example SPX 0.8, DAX 2.5 points); for multi-day CFD trades the swap is added, the overnight financing cost. 1 bps = 0.01%. Benchmarks: random markets (every minute candle mirrored at its open with probability ½: same volatility, no direction), placebo days without an event. No trading recommendation.
Of the patterns in our scan of September 2026, only the index event day in the FTSE 100 passed the global multiple-testing correction. It has a counterparty that has to trade at a known time, whatever the price. The second round tests more flows of this kind: pension funds, trend followers, leveraged ETFs, a collar fund, option pinning and the start of the quarter, plus a round to close gaps in Hong Kong, Japan and gold. For new tests the direction was fixed in advance, and only tests that stood out in the search got a holdout run. Dealer gamma has a separate study.
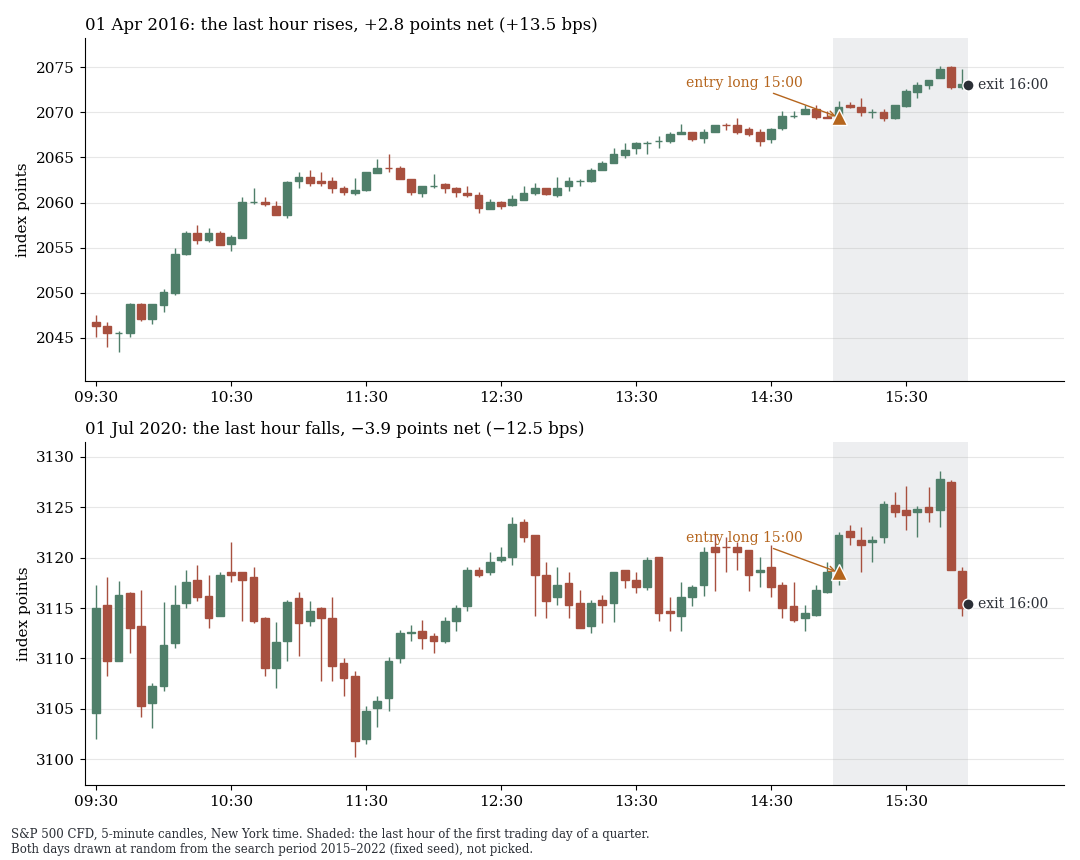
S&P 500, 5-minute candles on the first trading day of a quarter, long in the last hour (grey). Drawn at random from the 27 search-period cases (fixed seed): +2.8 points net on top, −3.9 below.
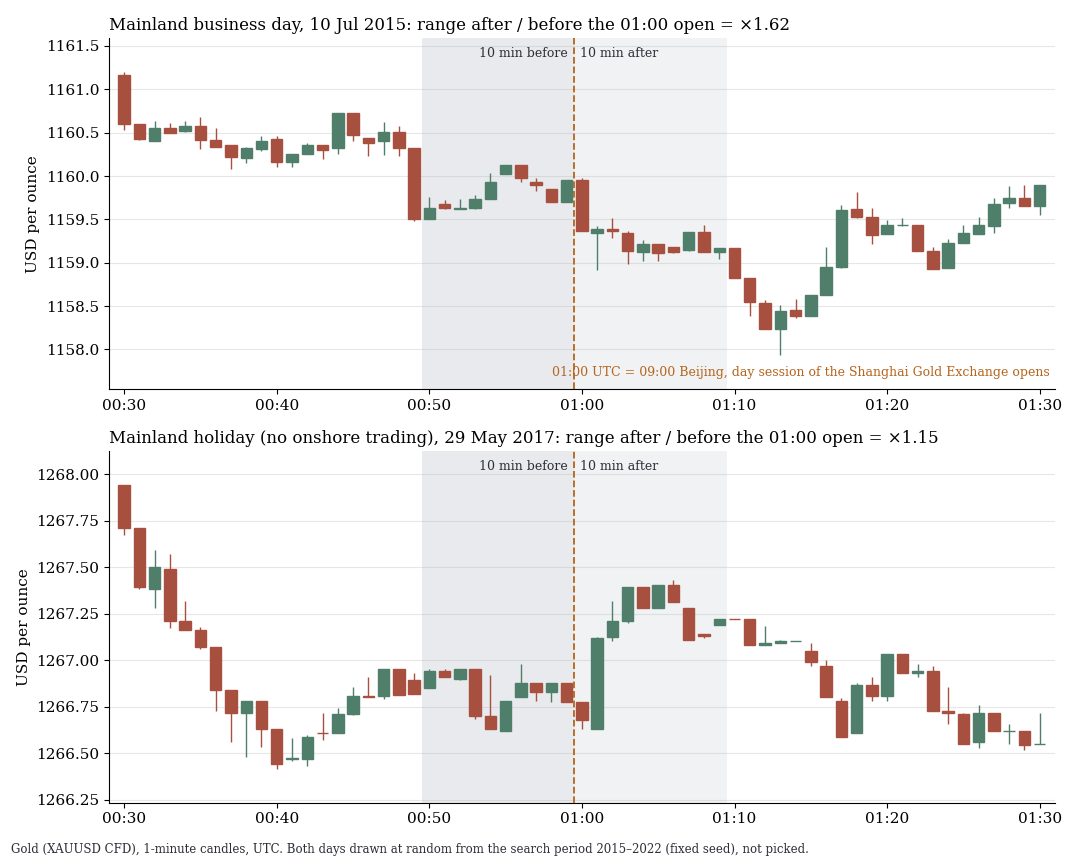
Gold, 1-minute candles at the open of the Shanghai Gold Exchange: a mainland business day and a holiday, drawn at random (fixed seed). Range after against before 01:00 UTC: ×1.62 and ×1.15, on average ×1.77 and ×1.09.
1. Pension rebalancing: the paper replicates, the effect does not hold out
Harvey, Mazzoleni and Melone (2025, NBER Working Paper 33554) argue that a 60/40 portfolio drifts from its target weights during the month and that pension funds rebalance at month-end, selling stocks after strong months. In the last five trading days the next-day stock return should therefore be lower the further the equity weight sits above 60%.
Our rebuild replicates this: the rule of selling at overweight and buying at underweight makes +6.95 bps per day in 1990–2022 (daily data, n 1,979, t 2.85). Per standard deviation of the signal, the next-day return falls by 18.3 bps (t −3.58); the paper reports 16.9. In the 2023 to August 2026 holdout (221 days) it is +3.17 bps (t 0.60) and −3.0 bps per standard deviation (t −0.54). The paper's publication falls into this period. On CFDs (one trade per month, five markets), +3.3 bps per trade remain after spread and swap in the search period (t 0.17) and −13.9 bps in the holdout (t −0.68).
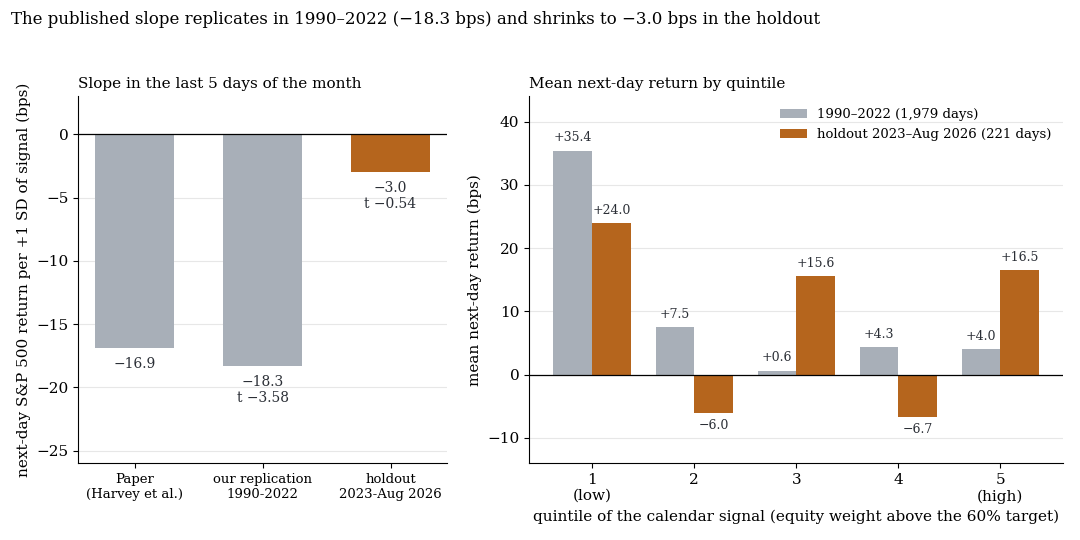
S&P 500, last five trading days of the month. Left: slope per standard deviation of the signal. Right: mean next-day return by quintile; in the holdout the quintiles no longer line up.
2. First day of the quarter in the S&P 500: the only test that passes locally
One observation from the scan: on the first trading day of a quarter the S&P 500 rises between 15:00 and 16:00 New York time, perhaps on fresh money. Search period: n 27, +11.4 bps net (t 3.30), positive in eight of eight years. Holdout, one run: n 13, +15.0 bps (t 2.26, one-sided p 0.012), also at double costs. That meets the local criteria set in advance, as the only test of this round.
It is not a finding. After the correction across all 26 holdout tests, q, the error probability corrected for multiple tests, is 0.12, where confirmation needs q ≤ 0.10. Four days carry the holdout, and without the five best it is negative (−1.47 index points, t −0.52). The cell comes from 6,316 time-of-day and calendar variants, and with n 13 the test had only 59% power even at the full effect.
3. Visible, but without direction: gold in Shanghai, Hong Kong
Gold. The day session of the Shanghai Gold Exchange opens at 09:00 Beijing time (01:00 UTC). On Chinese business days the range of the gold CFD in the ten minutes after is 1.77 times that of the ten before (n 1,930), on mainland holidays 1.09 times (n 132; Welch t 14.2). The reopening of the afternoon session (05:30 UTC) shows the same (×1.60 against ×1.03), the benchmark auctions do not (×0.89 and ×0.98). There is no evidence for a direction: directional rules around the Shanghai times already came out net zero in the fixings study.
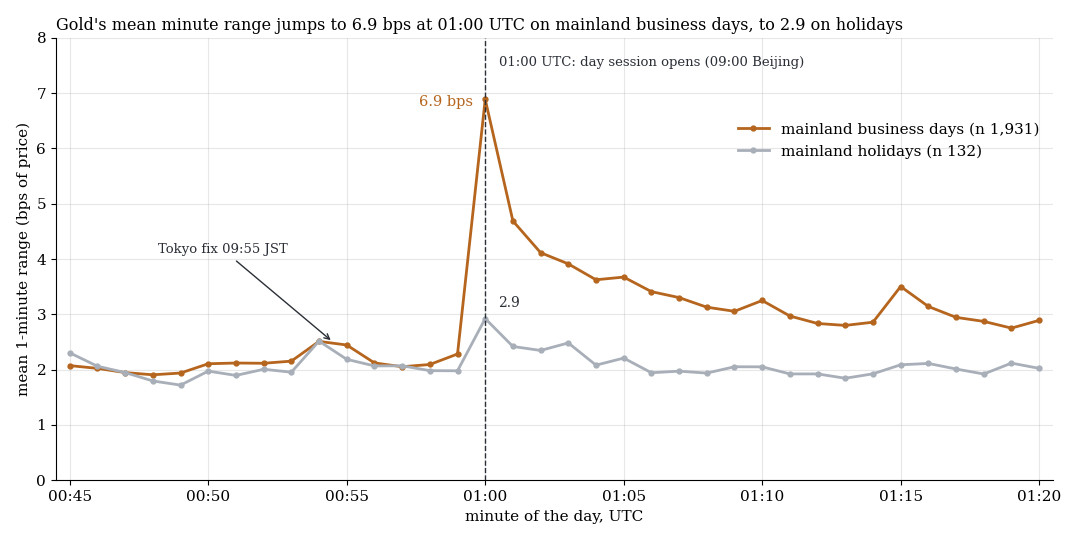
Mean range of a one-minute candle in bps, search period: 1,931 business days in China (orange), 132 mainland holidays (grey).
Hang Seng. For Hong Kong we have documented all 47 dates of the quarterly Hang Seng review from the index provider's press releases, a first. Our earlier calendar was wrong for 25 of them, and seven of the 15 wrong dates in the search period were in fact MSCI event days. On the documented 32 dates of the search period the range of the closing auction is 1.05 times that of placebo days (t 0.70). On MSCI dates in the same CFD it is 1.29 times (t 3.58). Under the pre-registration the test ended there, without a rule or a holdout.
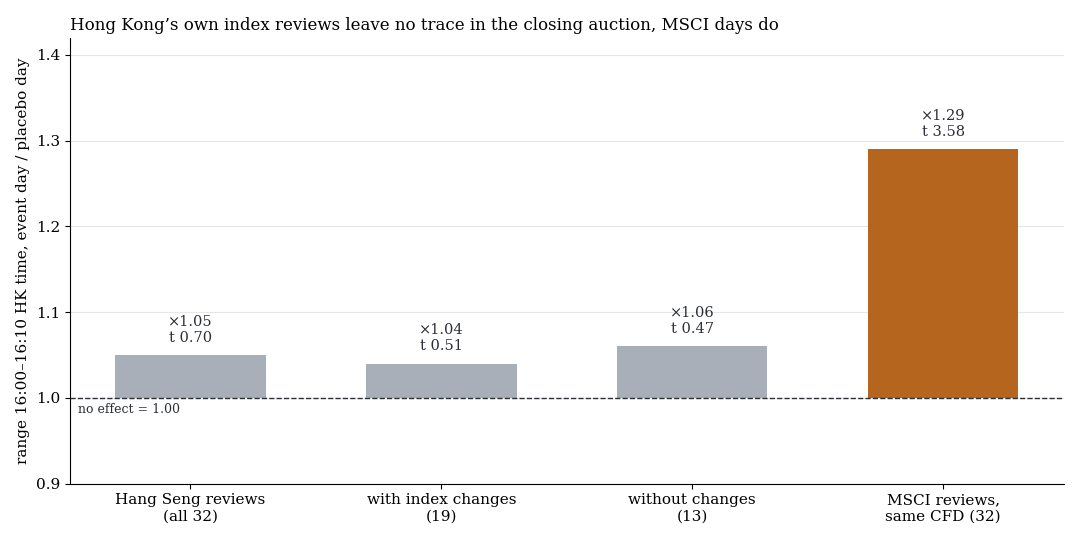
Range 16:00–16:10 Hong Kong time, event day against placebo day, HK50 CFD, search period. Grey: Hang Seng dates, orange: MSCI dates.
4. Four older observations in the holdout: one reversed, three shrank
Four cells with t between 2.5 and 3.5 from the time-of-day study had no holdout run. Each now got exactly one:
| Rule (all short) | Search period: n, net, t | Holdout: n, net, t |
|---|---|---|
| AUS200, last half hour on the last day of the month | 85, +7.60 bps, 3.52 | 38, −5.70 bps, −3.17 |
| JPN225, afternoon on the last day of the quarter | 29, +23.55 bps, 3.37 | 12, +3.98 bps, 0.77 |
| DAX, hour before the Eurex expiry | 96, +6.78 bps, 2.51 | 41, +3.68 bps, 0.68 |
| NQ, cash session on US monthly expiry | 89, +27.20 bps, 2.93 | 41, +10.05 bps, 0.82 |
The AUS200 rule changed sign: in 2023–2026 the index rose into the close on the last day of the month. We do not flip it, because a counter-rule formulated after seeing the holdout would be worthless. The other three keep their sign at t below 1. For DAX and Nasdaq the holdout had less than 50% power in advance, and Japan has only 12 days: not confirmed does not mean refuted there. After the global correction all four sit at q from 0.54.
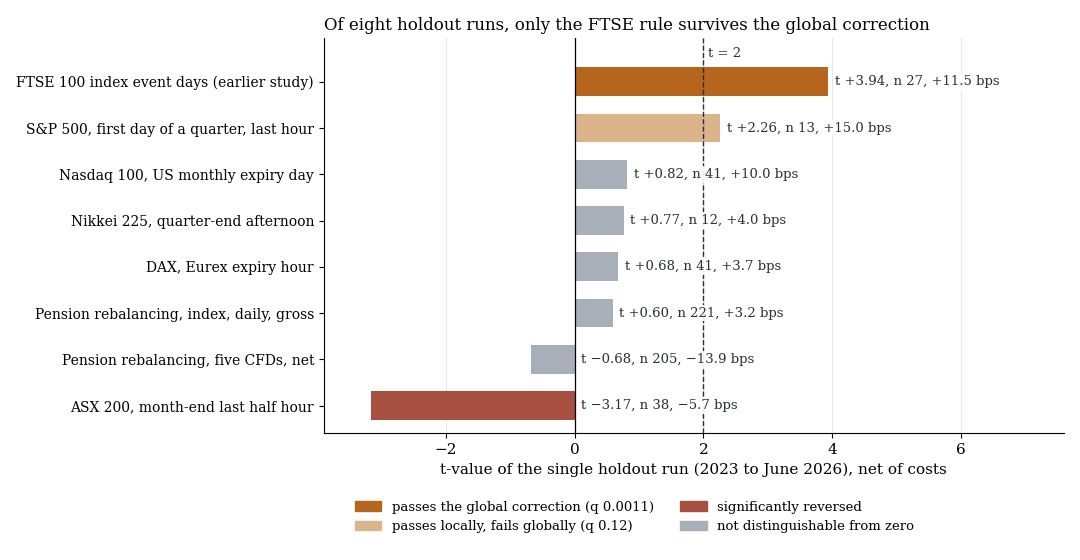
t-value of the single holdout run per candidate, net. Orange: passes the global correction, light: only locally, red: significantly reversed.
5. The map of this round
| Flow | Markets | Result |
|---|---|---|
| Index event days (earlier study) | FTSE 100 | confirmed: holdout +11.5 bps, t 3.94, q 0.0011 |
| Pension rebalancing at month-end | S&P 500, five CFDs | index 1990–2022 replicated, holdout t 0.60, CFDs net −13.9 bps |
| Start of the quarter | SPX | holdout t 2.26, but q 0.12 |
| Gold at the Shanghai open | Gold | volatility ×1.77 against ×1.09, directional rules net zero |
| Hang Seng event days | HK50 | auction range ×1.05, MSCI dates ×1.29 |
| Four older time-of-day observations | AUS200, JPN225, DAX, NQ | holdout t −3.17 to 0.82 |
| Trend followers, rebuilt triggers (20 to 250 days, moving averages) | SPX, NQ, Dow, DAX, FTSE, JPN225, gold | net +2.0 bps (t 1.2), arbitrary other triggers behave the same (difference t 0.95) |
| Leveraged ETFs, daily rebalancing with real fund sizes | SPX, NQ, Dow | net −1.5 bps, does not grow with the demand (t 0.27) |
| Collar fund, quarterly roll (JPMorgan Hedged Equity Fund, strikes from SEC filings) | SPX | close above the call in 21 of 40 quarters, 20.4 expected: no cap |
| Pinning at round strikes on expiry day | SPX, NQ, Dow, DAX | distance as on other Fridays (t 0.57, DAX −1.23) |
| Dividend reinvestment on the last cum-dividend day | JPN225 | −0.9 bps (t −0.08, n 10), daily data since 1990: March +45 bps, September −5.7 bps |
6. What our data cannot test
Not testable are real option positions by strike, imbalances in the closing auctions, the positions of trend followers, TOPIX reinvestment in Japan (only about 0.25 of 1.4 trillion yen of the flow is tied to the Nikkei 225) and the leveraged ETFs of Direxion.
What it means
There is no new tradable flow, and the FTSE event day remains the only confirmed finding (q 0.002 across all 59 holdout tests as of 8 October 2026). Flows are real and visible but without direction (gold in Shanghai, Hong Kong on MSCI dates). A paper effect can replicate up to 2022 and barely exist in the holdout. Observations from the search shrink in the holdout. That a flow exists does not mean a price window catches it.
Limits
- CFD minute data (BID), fixed costs. Spreads in auctions are wider in reality, and the HK50 CFD probably follows the future.
- Small samples. Start of the quarter n 13, JPN225 n 12, Japan n 10, Hang Seng n 32, collar n 40; below 40 event days a result counts as not robust. The four time-of-day cells and the start of the quarter come from 6,316 variants, so shrinking was to be expected.
- Pension rebuild. Price index instead of futures, bond without carry, swap at today's rates transferred to 2015–2022. At half the effect the holdout had little power.
- Other. Without Direxion the SPX demand is undercounted, and mainland holidays are a proxy that clusters in Spring Festival and Golden Week.
- Not tested: futures instead of CFDs, single stocks, a holdout for pinning, trend followers, leveraged ETFs, collar, Hang Seng and Japan.
All pattern families of the scan in the overview. Related: vol control and the fiscal year-end, index event days and the closing auction, the Tokyo fix in USDJPY.
📄 Full study as PDF: 10 pages incl. all tables, figures and limits (in German).
Disclaimer: Historical statistics are no guarantee of future market behaviour. This study is not investment advice. Trading carries a risk of loss up to total loss.