Data basis: 15 markets (DAX, FTSE, CAC, SMI, Dow, NQ, SPX, JPN225, HK50, AUS200, gold, EURUSD, GBPUSD, USDJPY, Bitcoin), Dukascopy CFD minute data (BID). Search period 2015–2022, separate holdout 2023 to 5 Jun 2026 (one run, best candidate only). 6,316 logged variants: windows of 15 and 30 minutes and 1 to 8 hours, periodicity, weekday, month cycle, expiry days, holidays, daylight saving time. Costs: spread plus slippage (indices 0.8 to 11 points, EURUSD 1.3 pips, gold 0.40 USD), index trading outside the cash session ×2.5, FX and gold at the rollover ×4. Benchmarks: random markets, comparison days without an event, shifted time windows. No trading recommendation.
The market has a clock. Cash opens, fixings, expiry dates and fund rebalancing force trading at fixed times, and traders derive rules from that: the first half hour, the quiet hours around noon, the turn of the month, triple witching. Such rules need no indicator, and among thousands of time windows there are always a few with a large t.
Every calculation therefore also ran on random markets (each minute candle mirrored with probability ½: same volatility, no direction), costs are inside every window, and we opened the holdout only after the search.
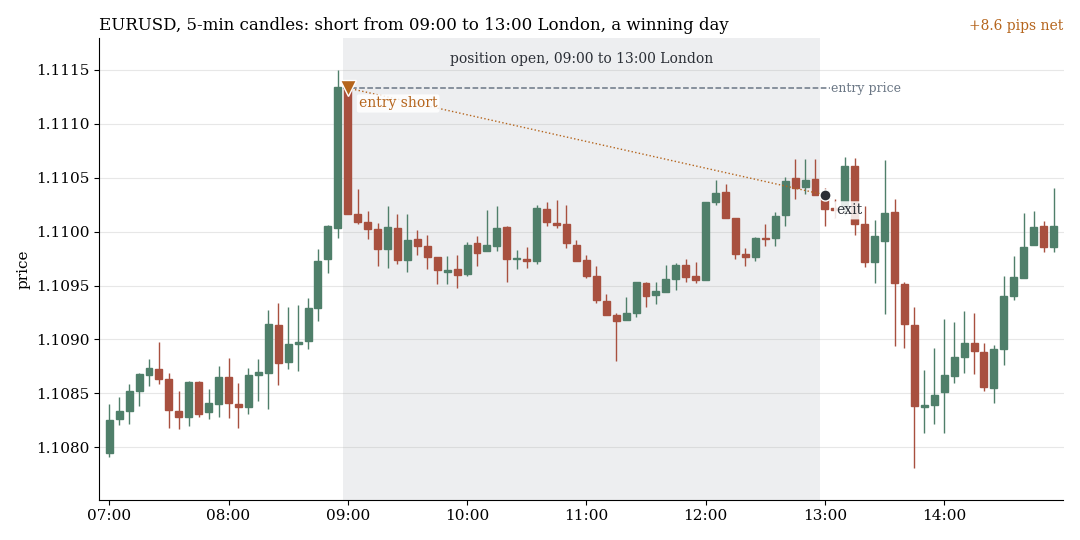
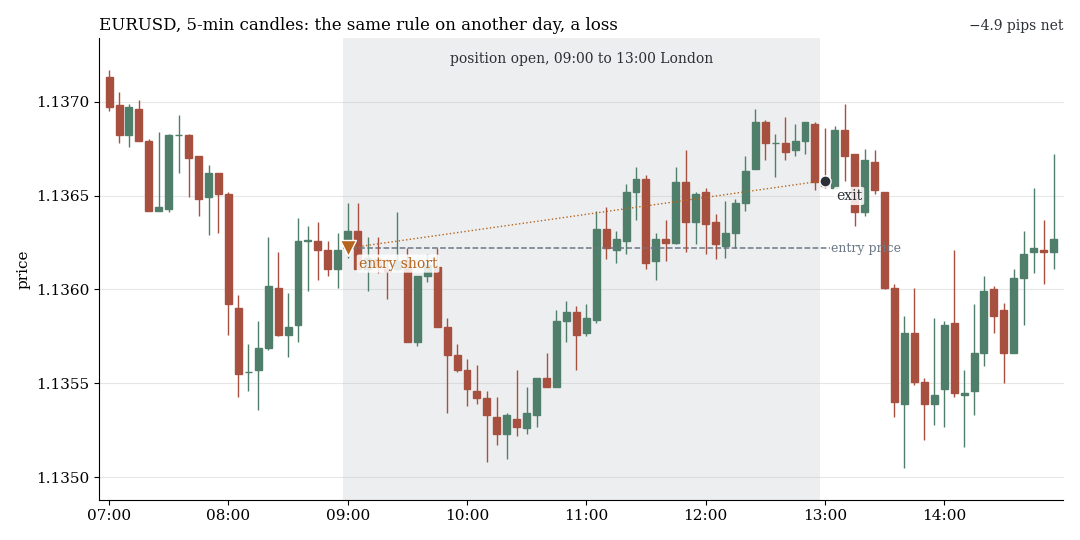
A pure time window, no signal: short every weekday at 09:00 London time, exit at 13:00. Top: 2 Aug 2019 (+8.6 pips net). Bottom: 23 Jan 2019 (−4.9 pips net). First winning and first losing day of a fixed-seed random draw from all trading days 2015–2022, not hand-picked.
1. The time-window map: structure yes, profit no
For every market we measured every window of 15 and 30 minutes and blocks of 1 to 8 hours, with the direction matching the sign of the search-period mean (which favours the pattern). Stable means: net t ≥ 3, positive in at least 6 of 8 years and in both halves, gross at least twice the costs.
There is structure: gross, 41 of 1,120 windows of 15 minutes have |t| above 3, against 1 in the random market. After costs nothing remains. Not one of the 1,675 windows of 15 and 30 minutes reaches net t ≥ 3, and of 963 windows in the ten indices none is positive (best t −0.9). Of 2,665 blocks only one meets all stability criteria (section 3). The most striking index windows sit at microstructure edges outside the cash session (pre-market, closing auction, reopening after the mid-session break in Asia) and are net negative.
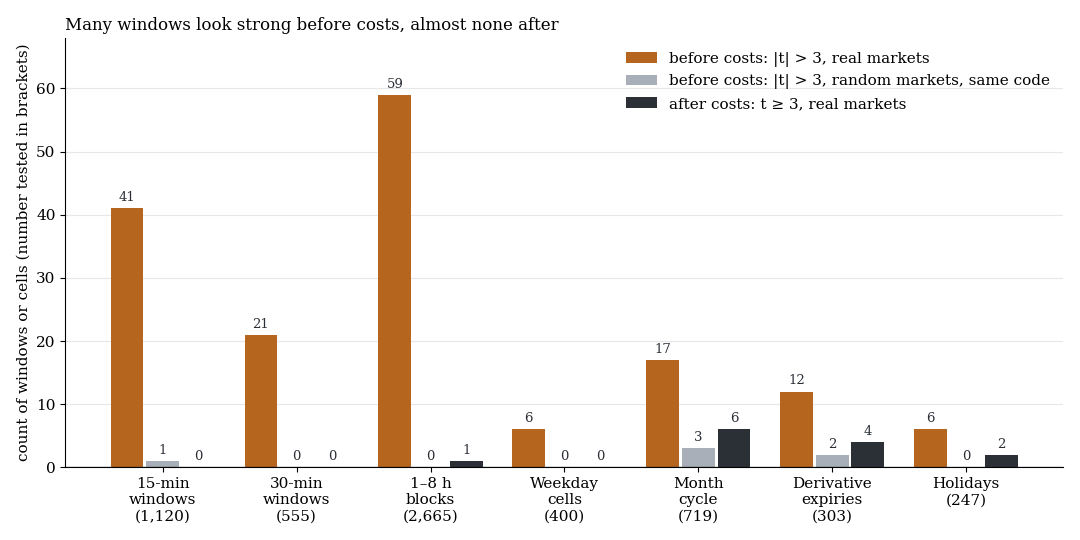
Orange: |t| above 3 before costs. Grey: the same on random markets. Dark: t ≥ 3 after costs. In brackets the number of windows or cells tested, search period 2015–2022.
2. The strongest spikes are a data artefact
The largest values on the map are not market moves. They sit at the daily rollover at 17:00 New York and at the gold reopening at 18:00 New York: GBPUSD gross t −13.5, EURUSD −11.9, USDJPY −6.2, gold +13.2. Dukascopy delivers only the BID. Around the rollover the spread widens, the BID drops shortly before and recovers afterwards: quote mechanics, not price movement. With rollover costs these windows sit at net t −35 to −50.
Gold shows it directly. Entry at 18:00: net +0.16 USD (t 2.7). One minute later: −0.13 USD (t −2.4). At 18:30: −0.33 USD (t −7.1). The profit exists only at the depressed first BID. We treat every FX or gold signal with a trade leg between 16:45 and 18:30 New York as suspect.
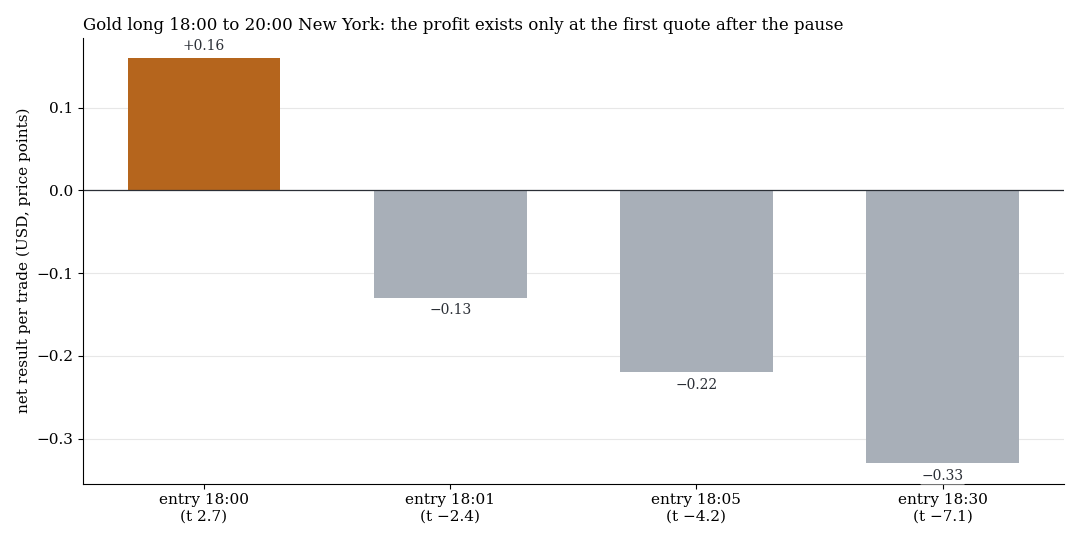
Net result per trade, only the entry minute changes. Orange: the only positive result. Search period 2015–2022.
3. The only stable find flips in the holdout
One block was stable in the search: EURUSD short every weekday from 09:00 to 13:00 London. It had n 2,075, gross 3.16 pips, costs of 1.3 pips and net +1.86 pips (t 3.4), was positive in 7 of 8 years and held in the walk-forward with +1.69 pips (t 3.0). The literature knows a mechanism (Breedon and Ranaldo 2013: currencies tend to depreciate during their own trading hours). The weaknesses were visible in the search: cost coverage of only 2.4 times, net zero at double costs, and q 0.48 after correcting over 6,316 variants. It was an observation, not a candidate.
| Metric | Search 2015–2022 | Holdout 2023–2026 |
|---|---|---|
| Trading days | 2,075 | 889 |
| gross | +3.16 pips (t 5.70) | +1.00 pips (t 1.58) |
| net (1.3 pips costs) | +1.86 pips (t 3.36) | −0.30 pips (t −0.47) |
| net at costs ×1.5 | +1.21 pips (t 2.18) | −0.95 pips (t −1.50) |
| net at costs ×2 | +0.56 pips (t 1.01) | −1.60 pips (t −2.52) |
| Hit rate | 52.6% | 52.0% |
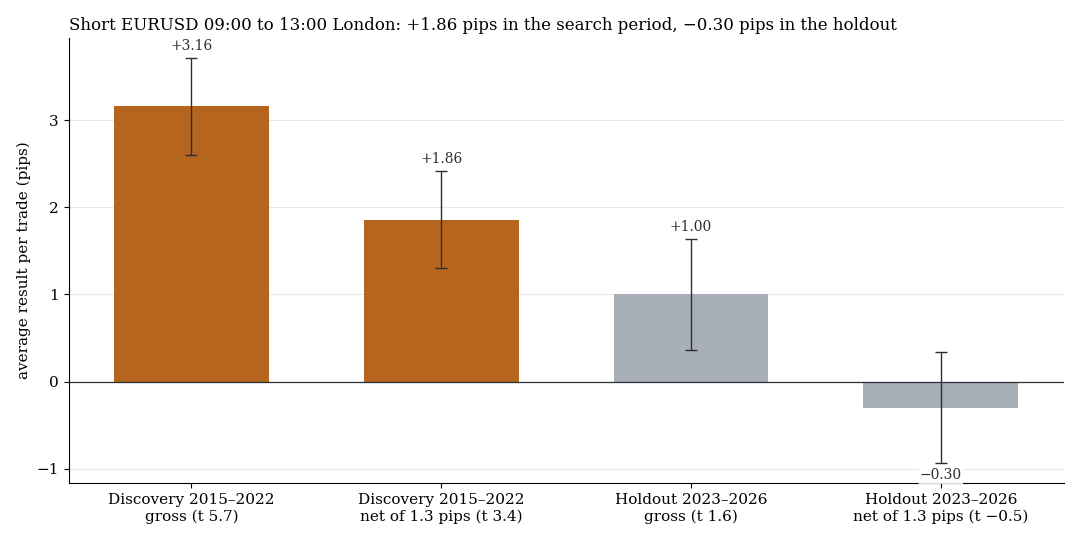
Mean result per trade in pips with one standard error. Orange: |t| ≥ 2. Holdout years net: +0.15 (2023), −0.59 (2024), +0.46 (2025), −2.46 pips (2026 to June).
Gross, the holdout shows the same direction, but only a third of the size and below the costs. The search value sits 3.4 holdout standard errors above the holdout estimate: the expected picture of a selection from 6,316 variants. With an unchanged effect the holdout would have produced t ≈ 2.2 on average. Effects of the search size are therefore refuted; a remainder of about 1 pip gross is not, but it lies below the costs.
4. Calendar: more structure than in the random market, but on few days
The calendar carries more structure than chance: 41 instead of 5 cells (weekday, month cycle, expiry, holidays) with a large t before costs. The 12 net hits with t ≥ 3 almost all hang on fewer than 40 event days or on a few single days (random market: 1).
- Turn of the month: not in the cash session in any market (gross t: DAX −1.0, Dow 0.75, SPX 0.73). Where it exists, it sits overnight (DAX t 2.1, FTSE t 2.3), outside an intraday rule.
- Month-end rebalancing: no effect pooled over ten indices (net t 0.45). A single AUS200 outlier (n 85) has no visible mechanism and was not checked in the holdout.
- Expiry days: DAX short in the hour before the Eurex settlement net +8.7 points (t 2.5, n 96), no reversal in the hour after (t −0.3). Triple witching in the FTSE: net t 3.6 at n 32.
- Holidays: nothing before the holiday (SPX t 1.1). After the holiday, FTSE net t 3.3 at n 49.
5. Periodicity and daylight saving time
The periodicity of Heston, Korajczyk and Sadka (2010) exists in FX (overall test t 3.38 in EURUSD, 1.91 in the random market), but only with 0.1 to 0.5 pips gross per trade against costs of 1.3 to 2.0 pips. All 150 trading rules are net negative. Daylight saving time shows what does work: on the 134 to 135 days with 5 instead of 6 hours between New York and Berlin, the volatility peak of the DAX moves from 15:30 to 14:30. It follows the US open, not the local clock.
What it means
Time of day moves volatility, not a direction that survives costs. Everything that looked large was data mechanics, a tiny sample or selection. A time rule needs a random market as control, blocked rollover and auction minutes, costs per window and a holdout that is looked at only once.
The one pattern of the scan that passed the holdout and the global correction does not hang on the clock alone but on forced flows on set dates: see index rebalancing days and the closing auction. The Tokyo fix in USDJPY runs as a forward test.
Limits
- CFD minute data (BID), no ticks. Rollover and auction minutes create false effects, spread spikes are missing, real fills are worse.
- Fixed cost model. The EURUSD find was already net zero at double costs in the search. We chose the direction in the search, the real test is the holdout.
- Only one candidate in the holdout (889 days, limited power). Calendar, periodicity and daylight-saving results are search results without a holdout, and groups with n below 40 are not reliable.
- The daylight-saving sample includes March 2020.
- Not tested: Bitcoin weekends, overnight and multi-day holding, seasonal month effects such as “sell in May”.
All pattern families of the scan in the overview. Related: The Turn-of-the-Month Effect, Price Weighting and the Calendar Profile of the Dow, Why Long Doesn't Beat Short.
Disclaimer: Historical statistics are no guarantee of future market behaviour. This study is not investment advice. Trading carries a risk of loss up to total loss.