Data basis: EURUSD, GBPUSD, USDJPY, XAUUSD, BTCUSD, AUS200, HK50; Dukascopy CFD minute data (BID), search period 2015–2022 (Bitcoin from 2017, CNY fixing from 12 Aug 2015). The holdout, 2023 to 5 Jun 2026, stayed untouched because no test produced a candidate. Costs per round trip: EURUSD about 1.15 bps, gold about 3 bps, BTCUSD 10 bps, AUS200 1.5 and HK50 7 points, USDJPY 0.016 yen. Benchmarks: random markets, placebo windows, “always long”. No trading recommendation.
What would a new signal need? After roughly 893,000 logged tests, our answer is a mechanism with a counterparty: someone who must trade at a fixed time, whatever the price. Fixings are the cleanest case: at 16:00 in London, 09:15 in Beijing or the ECB concertation at 14:10, banks, funds and companies settle at a reference rate.
We tested six such events with one recipe: fix direction and window in advance, check the effect against the size of the flow, add placebo windows and random markets. No test produced a candidate that earned a holdout run. The Tokyo fix in USDJPY is the exception and has its own study: the forward test.
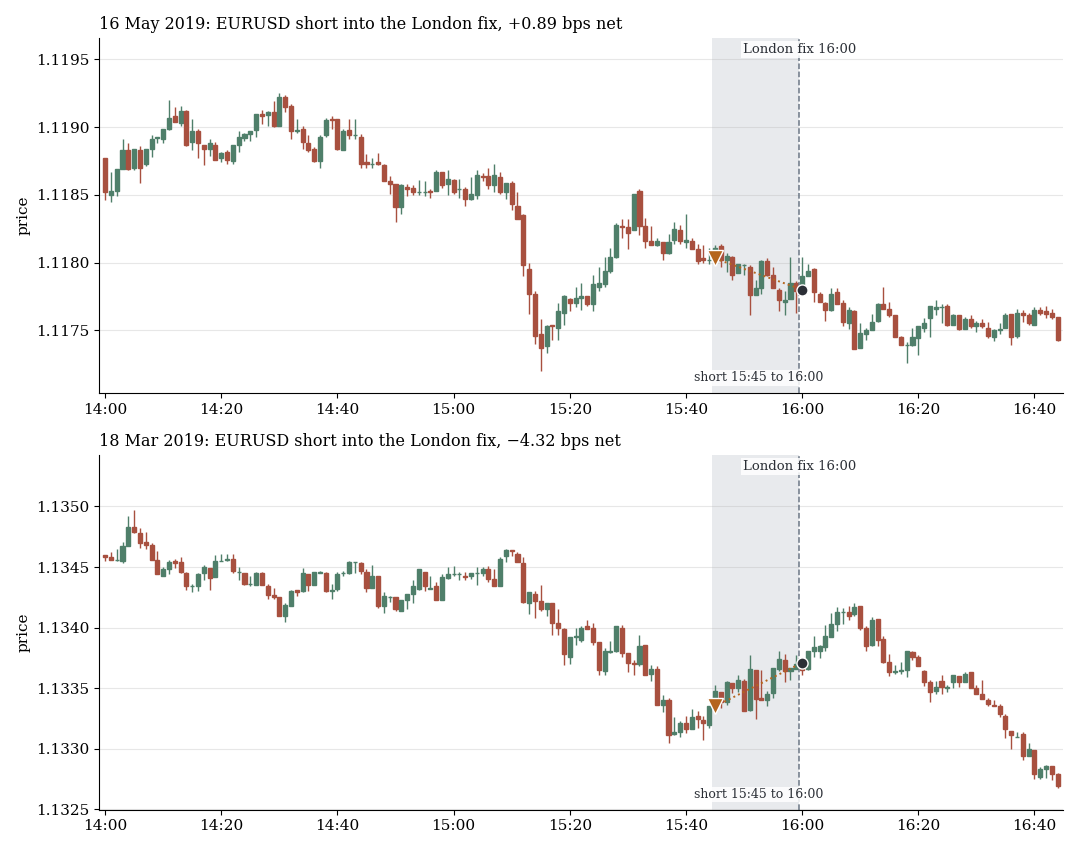
EURUSD short from 15:45 to 16:00: first positive (top) and first negative example (bottom), drawn at random (fixed seed), 2015–2022.
1. London 4pm fix: a structure below the costs
The WM/Reuters fix at 16:00 London is the big settlement event in FX. Set in advance: buy dollars before the fix, sell after, every weekday. In EURUSD (n 2,075) that means short from 15:45 to 16:00 and long until 16:30.
| Window in EURUSD | Gross (bps) | t | Net (bps) | t | Years > 0 |
|---|---|---|---|---|---|
| 15:45–16:00, short | +0.56 | 2.55 | −0.59 | −2.44 | 1 of 8 |
| 16:00–16:30, long | +0.69 | 3.51 | −0.47 | −2.48 | 2 of 8 |
The gross structure is tiny, and the cost of about 1.15 bps eats it. At month-end (n 96) the basket of EURUSD, GBPUSD and USDJPY sits at −2.5 bps gross (t −2.6) in the half hour after the fix, on the wrong side.
2. LBMA gold fixes: nothing above 1.4 bps
We tested 31 gold windows: LBMA fix (morning, afternoon), COMEX open and close, Shanghai benchmarks, sessions. The direction came from the data, which flatters the result. Still, every fix and open window sits at 1.4 bps gross or less, against about 3 bps of cost.
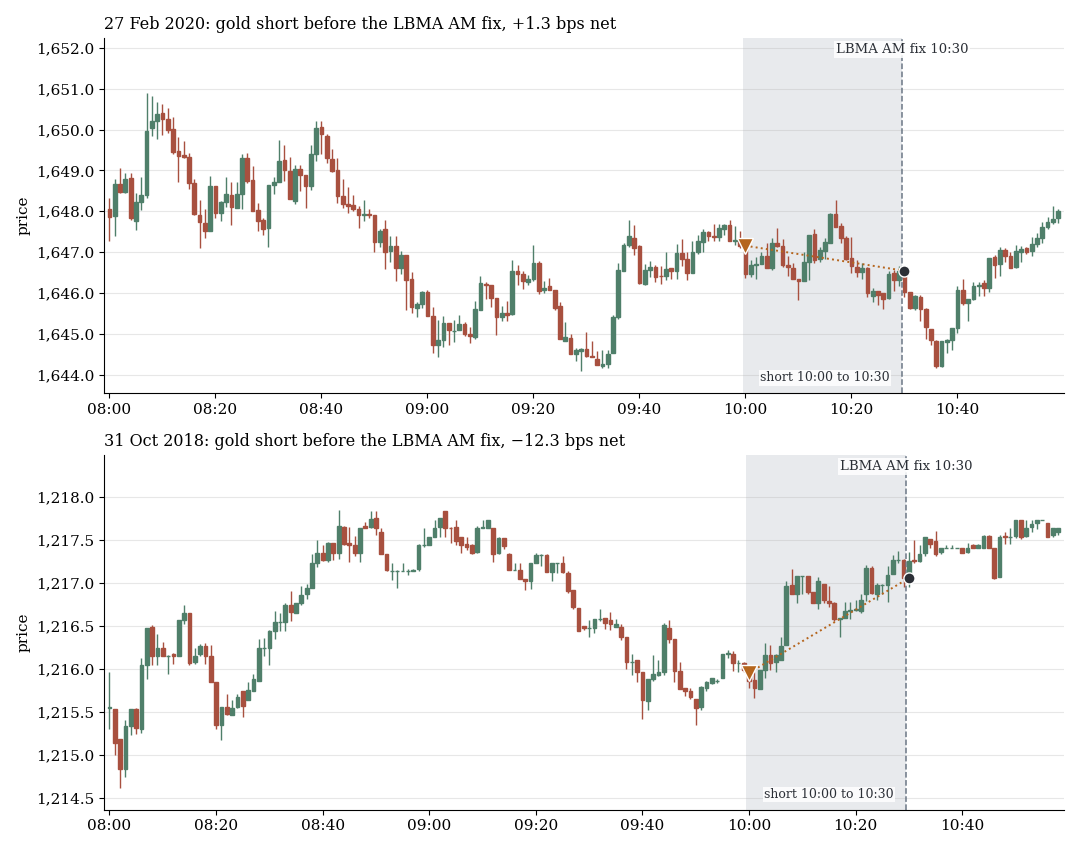
Gold short before the LBMA AM fix (10:00 to 10:30 London): first positive (top), first negative (bottom), drawn at random, 2015–2022.
The example window (n 2,062) returns +0.57 bps gross (t 2.12) and −2.25 net (t −7.78), positive in 0 of 8 years. The largest t belongs to the Shanghai benchmark (+0.9 bps, t 3.2), a third of the cost.
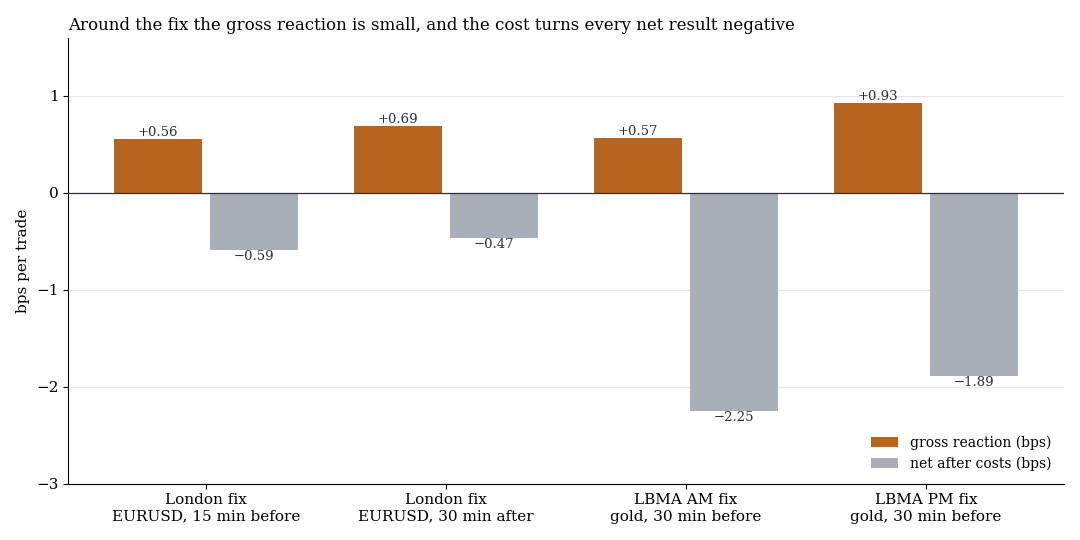
Gross (orange) and net (grey), bps per trade, four fix windows. The gap between the bars is the cost.
3. Bitcoin: funding and the CME gap
For funding (00, 08 and 16 UTC, set in advance: short before, long after) all 12 variants are net negative at 10 bps of cost (best t −3.6).
The CME gap: between Friday 16:00 and Sunday 17:00 Chicago time the future is closed, and the gap is supposed to be “filled” afterwards. We measured the move on the BTCUSD CFD (from December 2017, gaps of 50 bps or more, n 199).
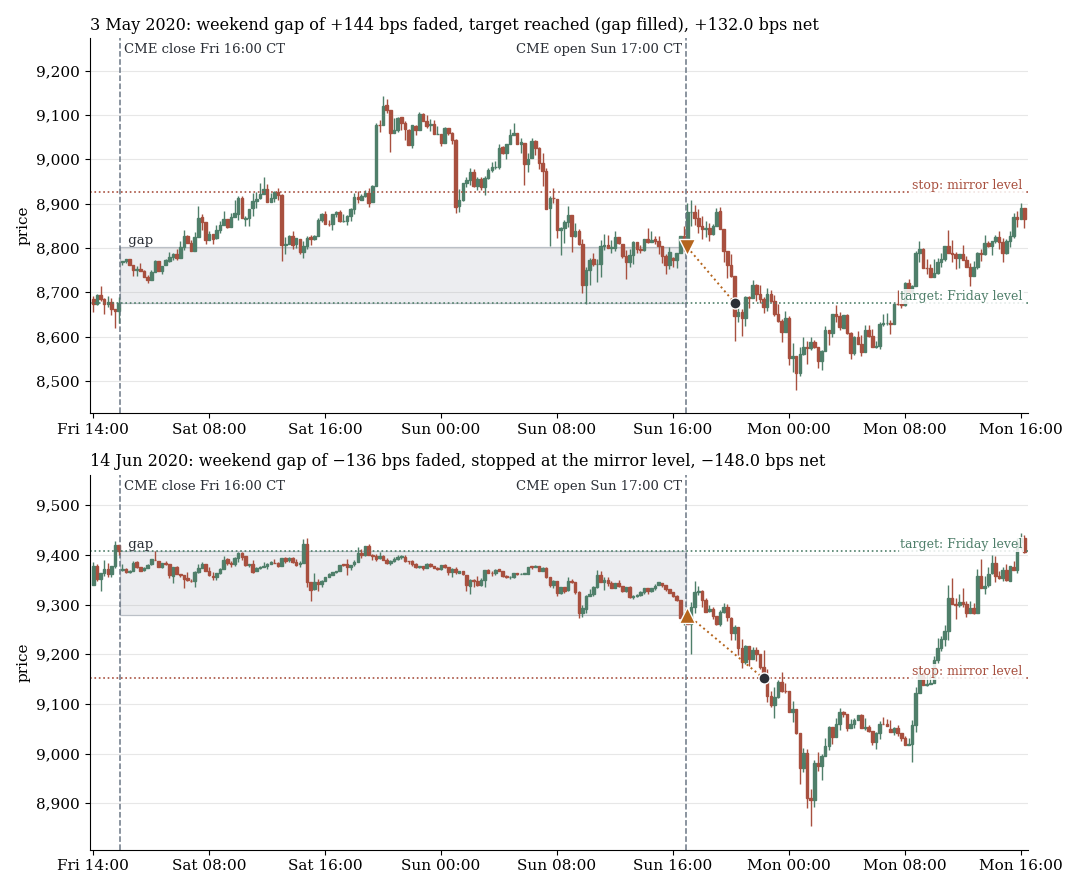
Gap fade: first positive (top, target reached) and first negative example (bottom, stopped at the mirror level), drawn at random, 2015–2022.
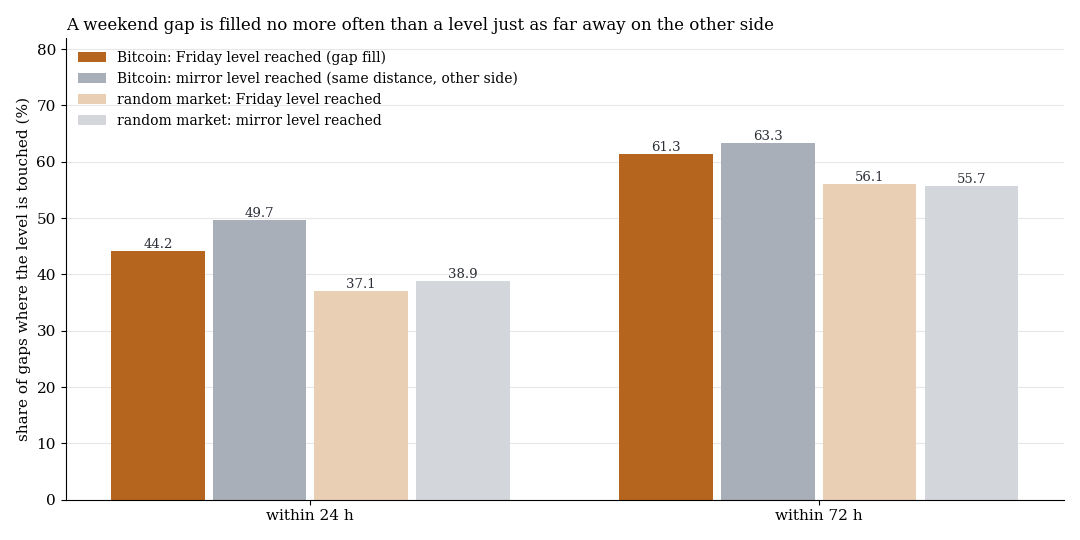
Share of gaps where the Friday level, or the mirror level an equal distance away on the other side, is touched. Bitcoin n 199, random market n 221.
Within 24 hours the gap fills in 44.2% of cases, the mirror level is reached in 49.7%. After 72 hours it is 61.3% against 63.3%: the rate of a random walk. The fade (target: Friday level, stop: mirror level) hits the target in 31.7% of cases, is stopped out in 42.7% and loses 28 bps net per trade (t −1.25).
4. PBoC CNY fixing at 09:15 Beijing
Every business day the Chinese central bank sets the USD/CNY midpoint; the onshore market may trade only within ±2% of it. Set in advance: if the fix is stronger than expected (against the previous onshore close), AUS200, HK50 and USDJPY rise in the hour after, the more so the bigger the surprise. Gold ran along without a fixed direction. The compulsion sits in the onshore market, which we do not trade; for us the fix is an information signal. There are 1,516 to 1,678 fix days per market.
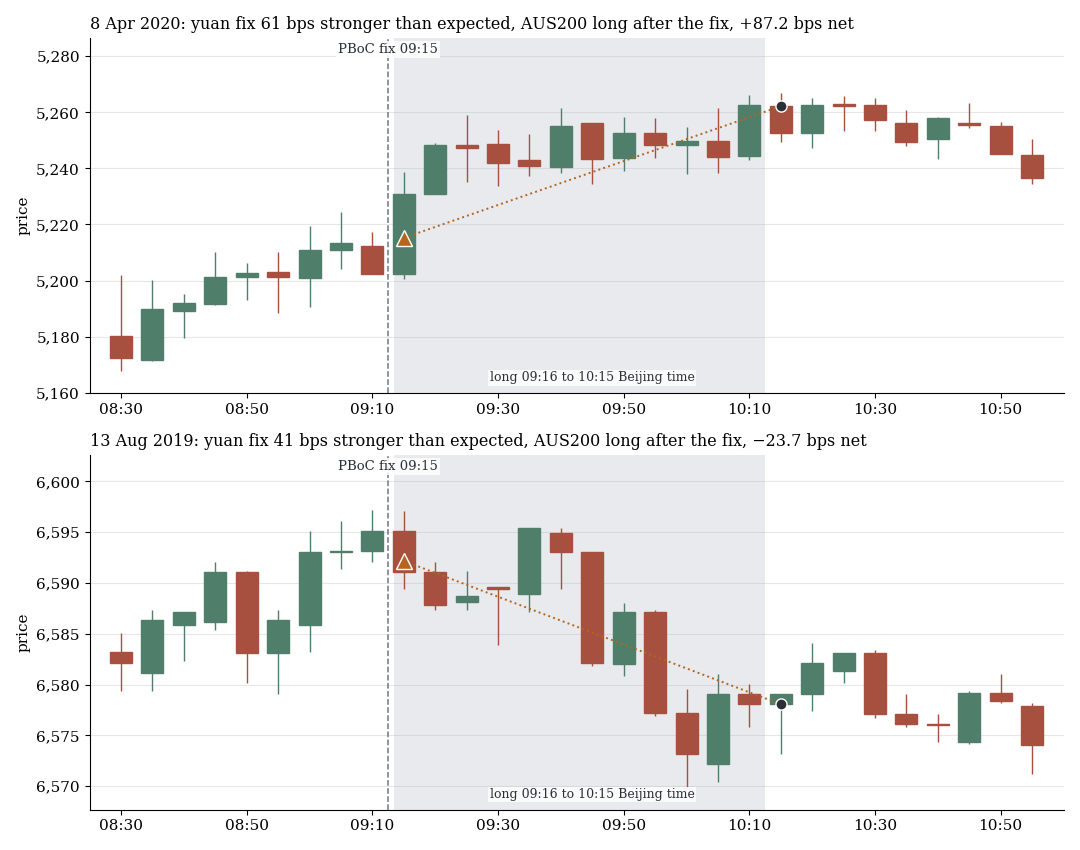
AUS200, 5-minute candles, largest third of the surprises: first positive (top) and first negative example (bottom), drawn at random, 2015–2022.
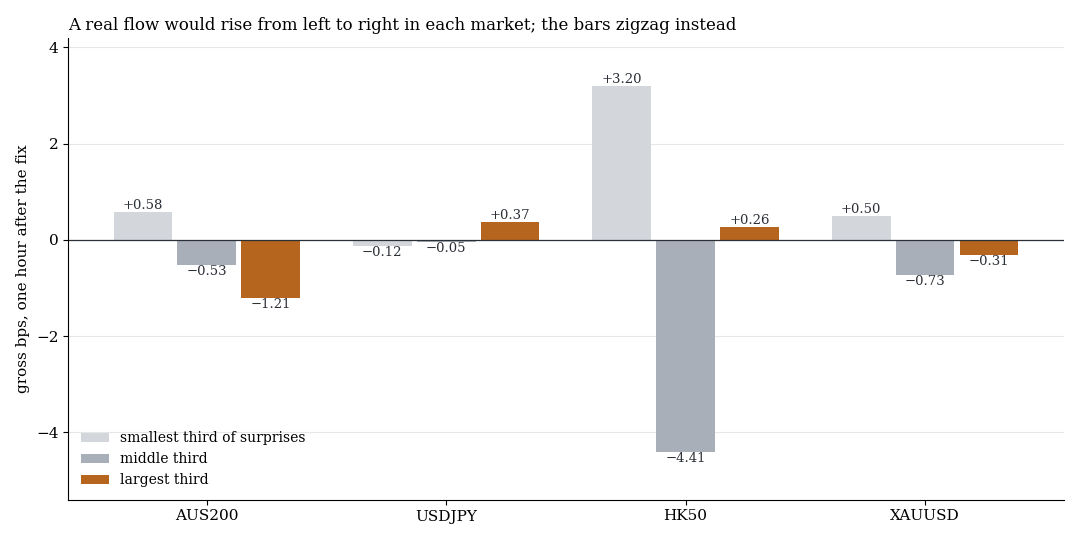
Gross result in bps in the hour after the fix by third of the surprise, 2015–2022.
The result is zero. All 104 direction variants sit between −3.1 and +3.2 bps gross, the largest |t| is 2.30 and has the wrong sign. Monotonicity is missing in every market. The largest third loses 2.4 bps net pooled over AUS200, USDJPY and HK50 (t −2.0). Random markets scatter just as much (t −1.92 to +2.76 against −2.30 to +2.15 real).
5. ECB reference rate, 14:10–14:15 CET
The reference rate is formed at 14:10 in the central banks’ concertation procedure. It is not a traded fix: since July 2016 it has been published only around 16:00, explicitly to discourage trading at the fix. Companies and funds still settle at it. Set in advance: more activity in the window, a snap-back against the pre-move (13:45 to 14:15), stronger effects at month-end. Without ECB council days and days with US data in the window, 1,280 days remain.
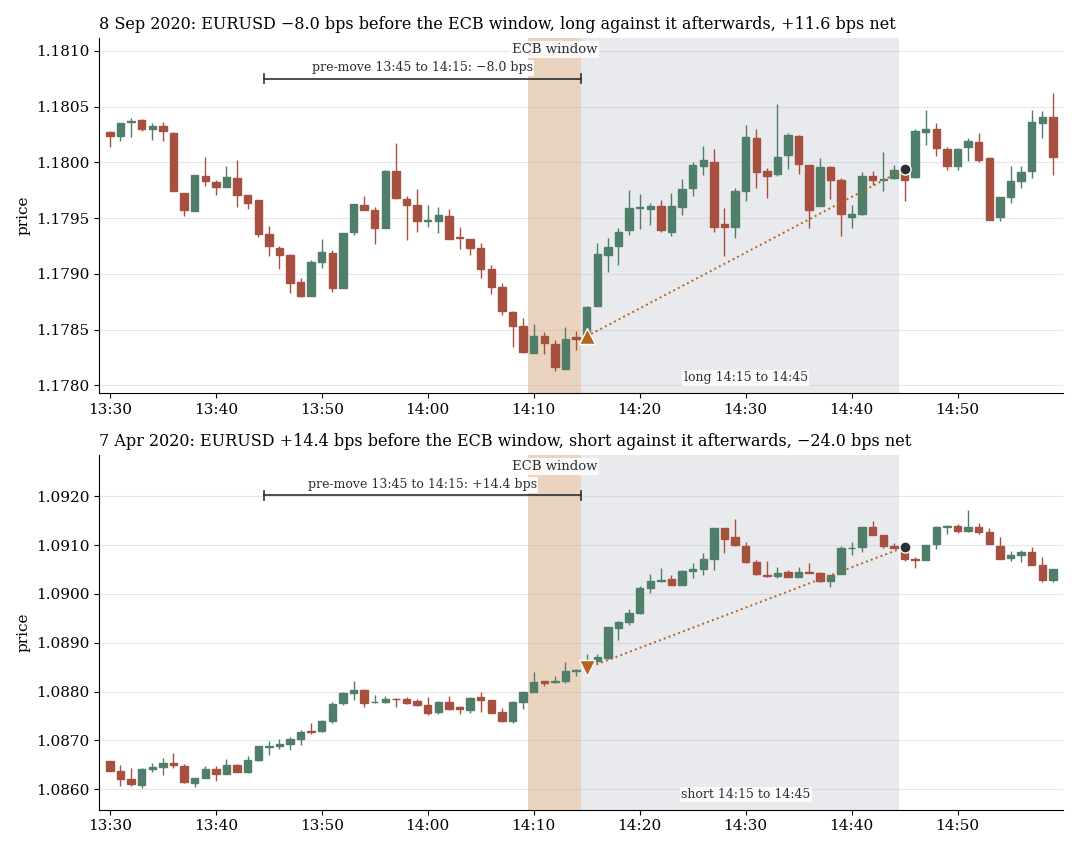
EURUSD, minute candles, reversal after the ECB window: first positive (top) and first negative example (bottom), drawn at random, 2015–2022.
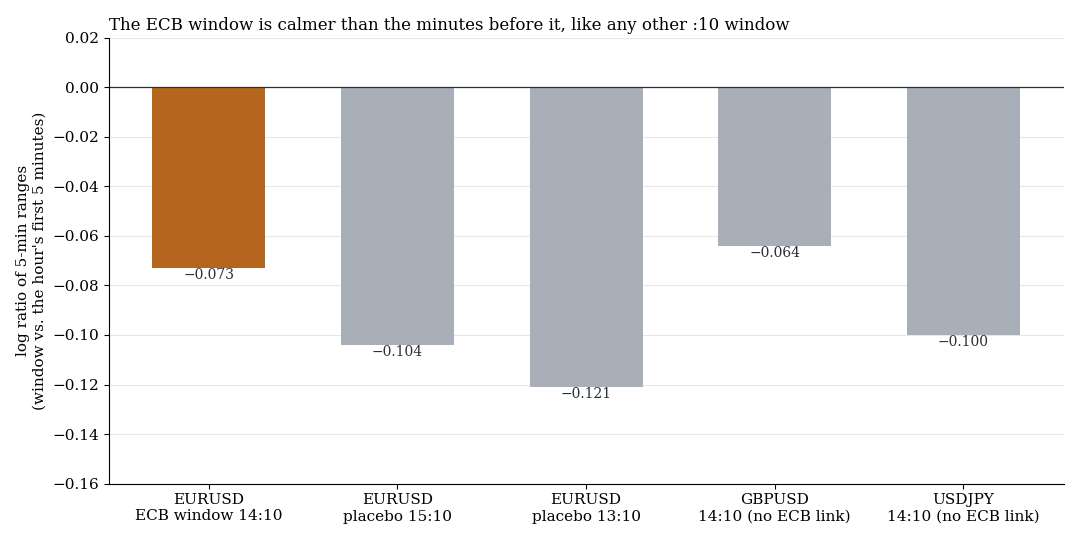
Log ratio of the 5-minute range in the :10 window to the range of the hour’s first 5 minutes. Orange: ECB window, grey: placebo windows and pairs without an ECB link.
The window is calmer than 14:00–14:05 (−0.073, t −4.3), like every other full hour (placebo 13:10 and 15:10: −0.121 and −0.104). Against the placebos it is marginally less calm (+0.03 and +0.05), and GBPUSD and USDJPY show the same or more. The reversal after the fix (largest third of the pre-move, n 295) returns +0.55 bps gross (t 0.96), −0.62 net (t −1.18), positive in 3 of 8 years. The thirds are not monotonic (gross −0.41, +1.12, +0.55), month-end (n 48, t 0.62) is too small, and the random market gives the same statistic. The nicest value sits in the placebo window one hour earlier (+1.79 bps gross, t 5.0, 8 of 8 years): not set in advance, absent from the control pairs, a side finding.
What it means
All six events have a counterparty with a clock time, and no test reaches a net t above 2 in the direction set in advance. Where gross t exceeds 2, the reaction is no bigger than the cost (London fix +0.69 bps against about 1.15 bps, gold +0.9 bps against about 3 bps, CNY at best +1.43 bps against about 1.4 bps). A counterparty supplies a hypothesis, not an edge. In our data only the Tokyo fix remains, and its forward test is running.
Limits
- CFD minute data (BID), fixed costs, no ticks. Real spreads at the fix moment tend to be wider, which only makes the zeros worse.
- Search period only. No confirmation on new data.
- Many cells. London fix 96 variants, gold 31, Bitcoin over 60, CNY 248, ECB 293. A few |t| ≥ 2 are to be expected.
- Small cells, direction choice. Month-end n 96 (London) and n 48 (ECB). In gold the direction came from the data. The CME gap is measured on the CFD, not on the future.
- CNY surprise approximated. The previous onshore close comes from a freely available price series (noise about 31 bps against about 45 bps of signal spread). The noise-free variant (fix against previous fix) shows the same zero (−3.3 bps, t −3.0).
- Not tested: economic-data surprises, USD/CNH, AUD/USD, CNH futures, EUR crosses, funding-rate level, option expiries, fix-order size (not observable).
All pattern families of the scan in the overview. Related: the month-end effect and the overnight drift.
Disclaimer: Historical statistics are no guarantee of future market behaviour. This study is not investment advice. Trading carries a risk of loss up to total loss.