Data basis: DAX, FTSE, Dow and Nasdaq, Dukascopy minute data, 5 January 2015 to 5 June 2026. Our older backtest chain for reference-candle setups (nine setup types, anonymised here as A to I), run unchanged on real data and on two random markets (seeds 11 and 12). Random market: every minute candle mirrored around its open with probability ½, opening gaps with a random sign, timestamps and volume unchanged. On a random market the honest expectation of every rule is minus costs. 498 cells (setup × market × exit × variant), Benjamini-Hochberg over all of them. No trading recommendation.
A ruler that nobody has checked measures its own shape. That is true for backtests too. Before you ask whether a setup makes money, you have to ask whether your calculation chain would also make money where there is nothing to earn.
We asked that question of our own older chain, the one that produced the R values of many breakout studies on this site. The answer was uncomfortable: on candles without any direction it still found profitable setups, in some cases almost exactly the same ones it found on real data.
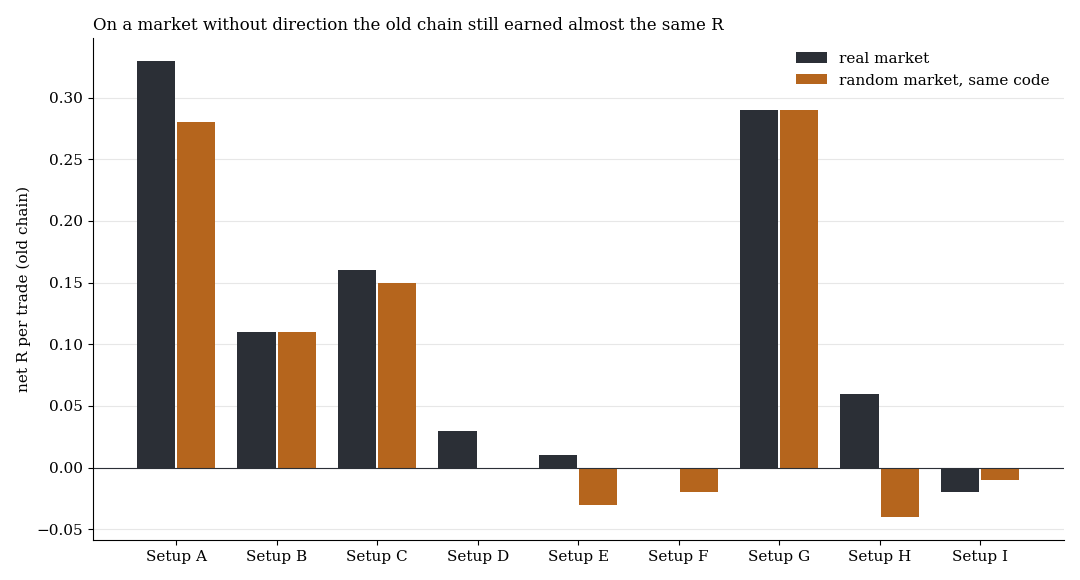
Net R per trade of the old chain on real data (dark) and on the random market (orange), four markets pooled. Setups anonymised. On a market without direction the correct value is minus costs, i.e. below zero for every setup.
1. How to build a market without direction
The random market starts from the real minute data. For every minute a coin decides whether the candle stays as it is or is mirrored around its open: a rise of 3 points becomes a fall of 3 points, the high becomes the low. The opening gap of each session also gets a random sign. Everything else stays: timestamps, volume, candle sizes, quiet and hectic hours, the clustering of volatility.
| Property | Real market | Random market |
|---|---|---|
| Volatility profile over the day | yes | yes, identical |
| Candle shapes (range, body, wicks) | yes | yes, mirrored |
| Volatility clustering | yes | yes (absolute minute returns correlate 0.55 to 0.60 with the real ones) |
| Direction, drift | yes | no (session returns correlate between −0.03 and +0.01 with the real ones) |
| Autocorrelation of minute returns | small | none (−0.002 to +0.003) |
| Lead-lag between markets | yes | no |
On such a market no rule can have an edge. Every trade pays costs, so the expectation is minus costs per trade, between −0.08 and −0.28 R depending on the setup. If a chain books more than that, the difference is produced by the chain.
2. What the old chain booked on the random market
| Setup | n | Real data | Random market | Honest value (minus costs) | Share of the real result produced by the chain |
|---|---|---|---|---|---|
| A | 10,994 | +0.33 R | +0.28 R | −0.16 R | 90% |
| B | 11,714 | +0.11 R | +0.11 R | −0.17 R | 99% |
| C | 9,752 | +0.16 R | +0.15 R | −0.12 R | 94% |
| D | 11,329 | +0.03 R | −0.00 R | −0.15 R | 80% |
| E | 11,605 | +0.01 R | −0.03 R | −0.08 R | 60% |
| F | 11,117 | +0.00 R | −0.02 R | −0.11 R | 77% |
| G | 7,129 | +0.29 R | +0.29 R | −0.16 R | 99% |
| H | 5,966 | +0.06 R | −0.04 R | −0.17 R | 56% |
| I | 5,748 | −0.02 R | −0.01 R | −0.17 R | 103% |
Four markets pooled, mean over both random seeds. Share = (random market minus honest value) divided by (real result plus costs).
Over all 498 cells the difference between the random market and the honest value was significant in 402 cells after the multiple-testing correction, positive in 393 of them. Setup A on the DAX with the trailing stop showed +0.60 R per trade on real data and +0.51 R on the random market, where −0.14 R would have been correct: a phantom edge of +0.65 R per trade with a t-value of 32.5.
What the real market added on top of the random market was small: +0.03 R per trade over the whole book, up to about +0.14 R in the strongest single cells, none of them with a t-value of 3. After subtracting the chain bias and the costs, no setup stayed above zero.
3. Where the phantom R came from
Three places in the chain, each one plausible on its own.
Late confirmation, early fill. The chain counted a breakout only once a candle with above-average volume confirmed it, but it booked the entry at the level. In 39 to 40% of the trades of setup A the level had already been broken before the volume candle; by the time the filter confirmed, the price was beyond the level. These trades earned +0.95 to +1.05 R on average, on real data as on the random market. The clean trades earned +0.02 to +0.06 R. Without the volume filter, the way a live EA with a stop order trades, setup A fell from +0.60 to +0.01 R on real DAX data. We had described this mechanism for a single midday setup in the study on the volume filter; the random market shows it across the whole chain.
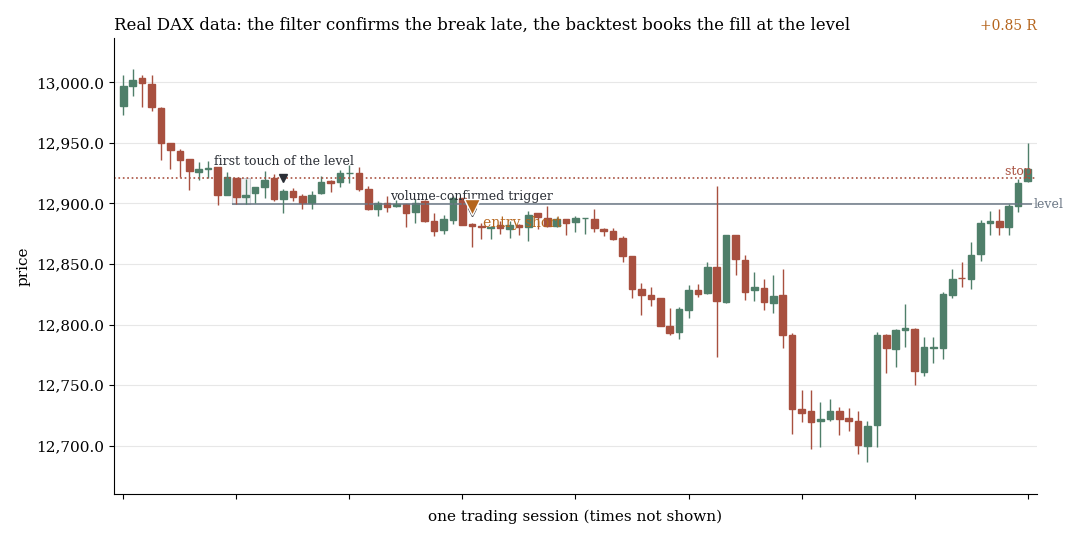
Real data, setup A. First touch of the level on the left, confirmation by the volume filter much later. The backtest books the short at the level, a price the market no longer offered at the time of the signal.
Fill at the level on first-minute breaks. In the first-candle setups 92% of the breaks happen in the very first minute after the reference candle, and the close of that minute lies on average 0.15 R beyond the level. The chain booked the fill at the level. Because the random market keeps the candle shapes, it produces the same premium.
The trailing stop on 15-minute candles. The trailing stop was simulated on 15-minute candles. When a candle touched both the stop and the next trailing step, the simulation assumed the favourable order. To isolate this, we entered at the trigger minutes with a coin flip for the direction and kept only the exit logic: +0.108 R gross per trade on the random market (t 35), +0.058 R with 5-minute candles, +0.025 R with 1-minute candles. The real market added +0.011 R. The trailing stop harvested almost no trend persistence, only its own rounding.
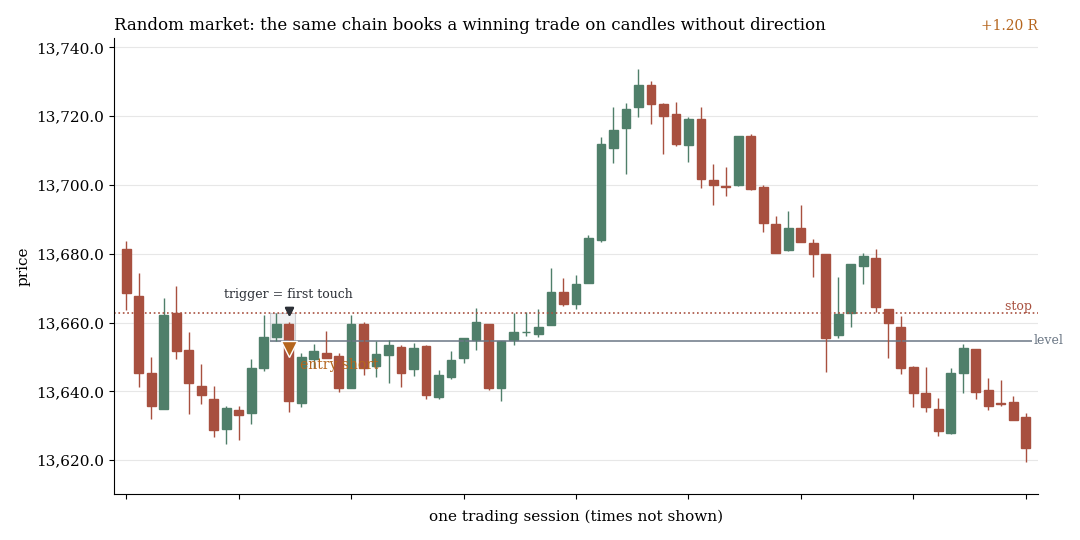
Random market, same code. The chain books a short at the level and closes it via its trailing stop at +1.2 R, before the later rise through the stop. The candles carry no direction; the profit comes from the booking rules.
4. The repair
We rebuilt the chain along the way a real order works:
| Component | Old chain | Repaired chain |
|---|---|---|
| Trigger | candle with volume confirmation | first minute that crosses the level, no volume filter |
| Fill | at the level | stop order: the worse of level and open of the breaking minute, plus costs |
| Price path | from the open of the signal candle | from the breaking minute |
| Trailing stop | favourable order inside a candle | stop only from completed candles, gap through the stop filled at the open |
The isolated exit test now shows +0.009 R gross instead of +0.108 R, and the value no longer depends on the candle size (15, 5 and 1 minute within ±0.005 R). On the random market the phantom edges shrink sharply:
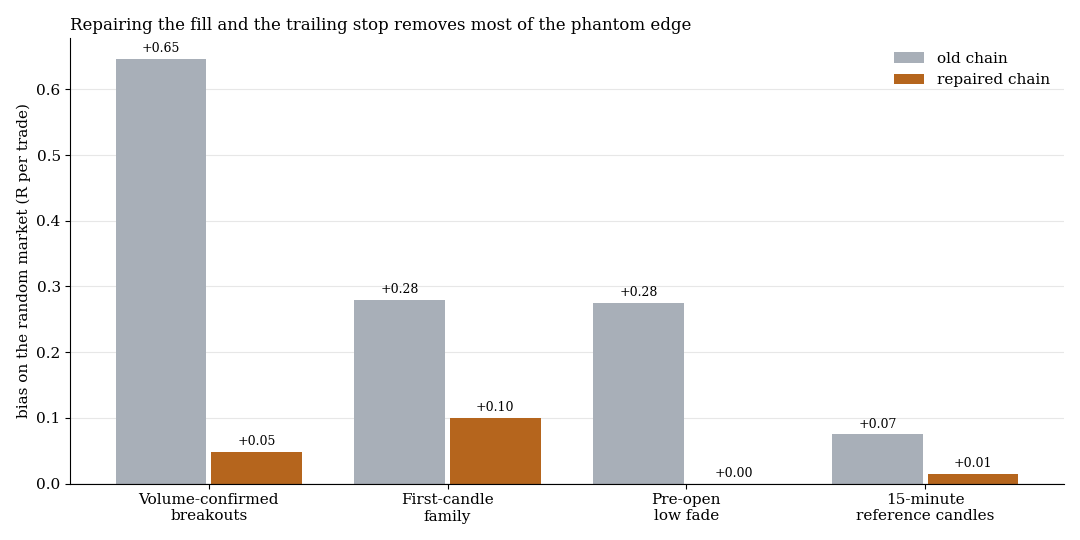
Bias on the random market (result minus honest value) in R per trade, old and repaired chain, two seeds.
| Setup family | Old chain | Repaired chain |
|---|---|---|
| Volume-confirmed breakouts | +0.65 R | +0.05 R |
| First-candle family | +0.28 R | +0.10 R |
| Pre-open low fade | +0.25 to +0.30 R | about 0 |
| 15-minute reference candles | +0.04 to +0.11 R | 0.00 to +0.03 R |
19 of 33 setup and market cells now stay within ±0.03 R of the honest value, compared with 0 of 33 before. What remains sits below the minute resolution: the minute that breaks a level tends to keep running, and a stop fills at −1 R even when the minute closes further away. Both are part of real candle shapes. Whether a tick-fast EA can actually harvest them, only a test on real broker ticks can show.
5. What it means
Every backtest chain needs its own zero line. Run the identical code on a random market. Whatever comes out there is the chain, not the market. This check takes a few hours and would have saved us months of work on phantom edges.
Store numbers without a random-market column are no evidence. For a long time our backtests and our MT5 tests on real ticks differed by a factor of three to five. That gap is now essentially explained. Example setup G on the Nasdaq: +0.24 R per trade in the old chain, of which +0.22 R also on the random market; the residue of +0.03 R (t 0.5) is zero, and MT5 real ticks gave a profit factor of 1.13. MT5 real ticks remain the benchmark.
Older studies on this site. Studies that report R values from this chain carry this bias; their absolute levels are too high. Comparisons within the same chain (exit A against exit B, filter on against filter off) are not automatically wrong, but they are not proven either. 24 older studies carry a note at the top (15 fully affected, 9 in part), and we are re-running the central numbers on the repaired chain. Negative verdicts from this chain hold in their direction, because the bias is positive; positive findings from it are not proven.
The fresh scan was built with this lesson. In the search across about 150 pattern families every calculation chain ran against random markets from the start, and entries were booked at prices the market actually offered. For hit rates with fixed stop and target, the random-walk yardstick is the simpler zero line.
6. Building your own random market
- Take minute data with open, high, low and close.
- For every minute draw a coin. On heads keep the candle; on tails mirror it around its open in log space: new close = open − (close − open), new high = open + (open − low), new low = open − (high − open).
- Give every gap between one candle's close and the next candle's open a random sign as well, and rebuild the price series from these returns.
- Keep timestamps and volume. If your costs are fixed in points, anchor the first open of each day to the real open so the price level does not drift.
- For several markets, use the same coin per minute across markets, so that simultaneous moves stay simultaneous.
- Run at least two seeds, and compare against minus costs, not against zero.
7. Limits
- Necessary, not sufficient. The random market keeps candle shapes and volatility clustering. Structure below the minute (breaking minutes that keep running, stop fills inside a minute) is not neutralised. A chain that shows zero on the random market can still be optimistic in reality.
- Two seeds, four markets. The spread between seeds is visible in single cells; larger seed-to-seed variation cannot be estimated with two seeds. The cells are not independent (same days, same seeds).
- Minute resolution. Whether a trade was confirmed late is classified to the minute, not to the tick.
- Repair in progress. The repaired chain passed the random-market acceptance in 19 of 33 cells. New real-data anchors and the comparison with MT5 real ticks are still running; until then no R value of the repaired chain counts as evidence either.
- Not tested: other exit parameters, position sizing, overnight holding, markets outside these four.
Disclaimer: Historical statistics are no guarantee of future market behaviour. This study is not investment advice. Trading carries a risk of loss up to total loss.