Correction, 29 September 2026: Section 2 says that in the morning the breaking candle and the volume candle are the same, and section 4 concludes that the established morning setups were practically unaffected. Both were wrong. A test on a random market showed that in 39 to 40% of the trades of the strongest morning setup the level had already broken before the volume candle; without the volume condition its result falls from +0.60 to +0.01 R. The mechanism described here is confirmed, its reach was larger. All R values in this study come from our older backtest chain. Details: The random market as a ruler.
Re-run, 5 October 2026: Without the faulty entry the midday windows come to −0.10 to −0.17 R per trade on the corrected chain (old chain: +0.57 to +0.92 R). All numbers: Our own breakout rules, re-measured.
Data basis: NQ, Dow and SPX, 05 Jan 2015 – 05 Jun 2026, 10-minute reference candle at 18:10 Berlin (US midday), break in either direction, stop at the opposite side of the reference candle, first break counts, entry cutoff 3 hours. Exit: trailing stop BE 0.5 / TS 1.0 / step 0.5, net of spread and slippage, standard errors clustered by day. Lag and gap measured on NQ and Dow. No trading recommendation.
Volume confirmation is one of the rules found in almost every breakout textbook: a breakout only counts once it is accompanied by above-average volume. The logic is intuitive — a break without participation is a failed breakout waiting to happen. Accordingly, such a rule had sat in our signal generation for years as a matter of course: a break is only valid in the first candle that satisfies both conditions, level broken and volume at least at its 20-period average.
For our established morning setups this was never a problem. Volume there is above average anyway, the condition is met in the break candle itself, and the chain works as intended. The problem only surfaced when we carried the mechanics into a time window it was never built for.
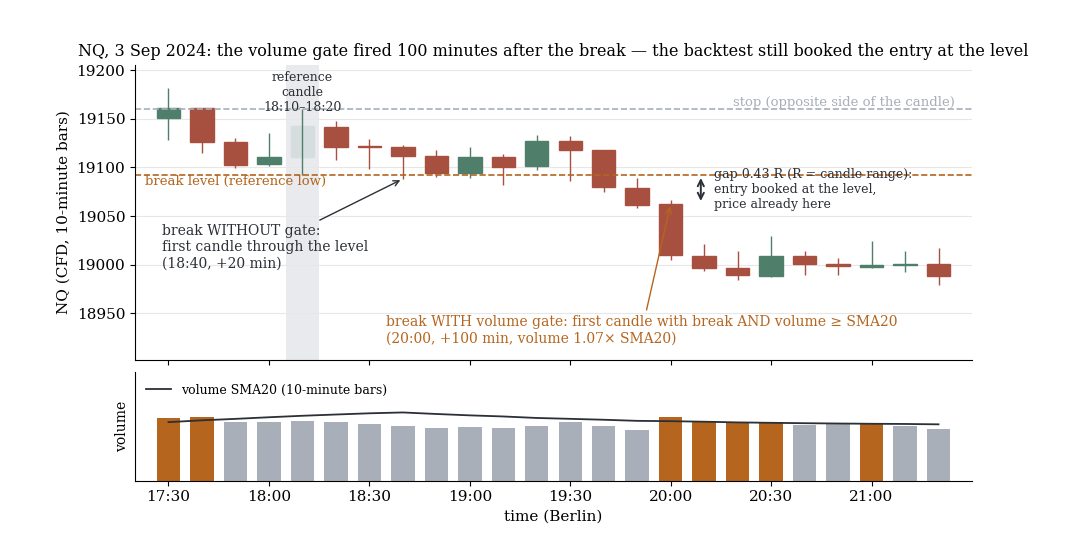
NQ, 10-minute candles: the break without the gate comes 20 minutes after the reference candle, the break with the volume gate only 100 minutes later. The backtest still books the entry at the level although price has long moved on.
1. The finding that was too good
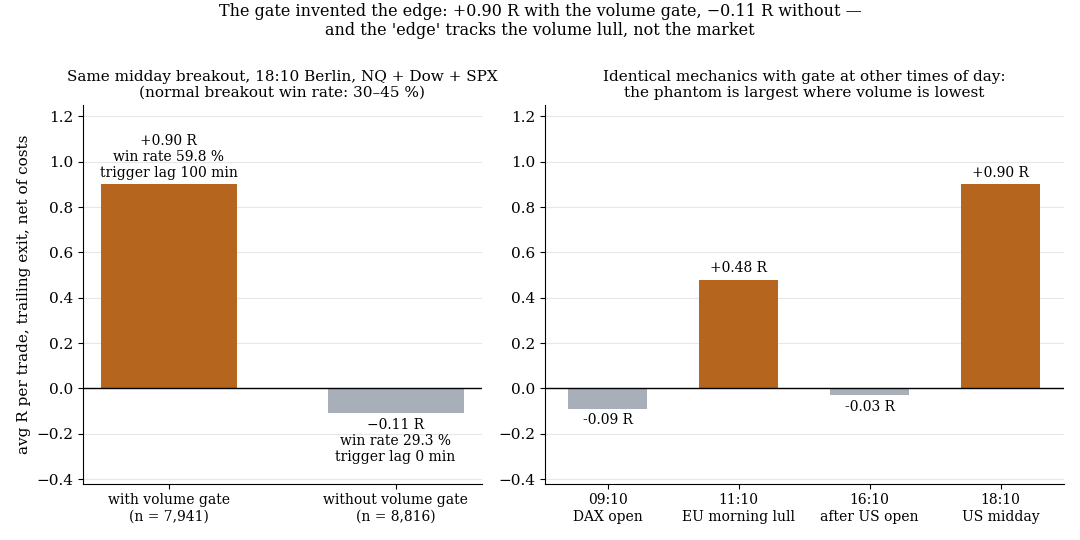
The gate invented the edge: +0.90 R with it, −0.11 R without. The same mechanics at other times of day show that the phantom is largest where volume is lowest.
We tested a reference-candle breakout in the US midday lull — 18:10 Berlin, 12:10 New York, the quietest phase of the US session. The result:
| Variant | n | avgR | Win rate | Trigger lag (median) |
|---|---|---|---|---|
| With volume gate | 7,941 | +0.90 R | 59.8% | 100 min |
| Without volume gate | 8,816 | −0.11 R | 29.3% | 0 min |
The first row would have been by far the best setup in our system, positive every single year. The second row is the truth. The entire "edge" of one R per trade was an artefact of the computation chain.
The first warning should have been the win rate. A breakout with the stop at the opposite side of the reference candle runs at 30 to 45% win rate across all our markets and years. That is not a weakness but the structure of the setup: you pay many small losses for a few large wins. A 60% win rate on a breakout is not a finding, it is a bug. We did not see it immediately because the result was stable year after year — stability is a poor bug detector when the bug itself is stable.
2. The mechanics of the error
Two steps in the chain did not fit together. The signal generation sets the trigger to the first candle that satisfies level and volume condition. The episode construction sets the entry, unchanged, to level plus costs — as if one had bought exactly at the break.
In the morning that is the same candle. In the midday window it is not. There, volume sits almost continuously below its 20-period average, price runs through the level, and the volume condition is only met candles or hours later — when afternoon activity picks up. By then, price is long past the level. The backtest buys retroactively at a price that no longer exists.
Measured on NQ and Dow:
| Metric | Midday setup (18:10) | Comparison: morning setup |
|---|---|---|
| Trigger lag (median) | 100 minutes | 0 minutes |
| Price beyond entry level at trigger (median) | +0.35 R | — |
| Share of trades with price beyond level | 63% | — |
| 75th percentile of the distance | +1.2 R | — |
The median trade was therefore booked with a free head start of 0.35 R, one in four with more than 1.2 R — and the stop sat correspondingly further away than was actually possible. That produces a 60% win rate and +0.90 R without any market behaviour behind it.
This is lookahead bias, even if it does not look like it. No feature looks into the future; the entry price does. The error class is the same as in our post-mortem on the feature leak: a value is used at a moment when it is no longer genuinely available.
3. The diagnostic signature: the time-of-day grid
Before we had the cause in the code, a benchmark showed us that something was wrong. We placed the identical mechanics — 10-minute reference candle, break either side, stop at the opposite side, trailing exit — on a grid of times of day across the whole trading day, NQ, Dow and SPX pooled:
| Time (Berlin) | Market phase | avgR with volume gate |
|---|---|---|
| 09:10 | DAX open | −0.09 R |
| 11:10 | European late-morning lull | +0.48 R |
| 16:10 | shortly after US open | −0.03 R |
| 18:10 | US midday | +0.90 R |
The pattern is unambiguous: the phantom edge is anti-correlated with trading activity. It is largest exactly where the least trading happens; where the market is active — DAX open, US open — it disappears. A genuine time-window setup would behave the other way round, or at least would not follow the volume curve this cleanly. An edge that has exactly the shape of the volume gap is an edge of the volume filter, not of the market.
The grid is therefore a general tool: when a new time window looks conspicuously good, put the same mechanics on all other times of day. If the quality runs along the activity curve, the mechanics are the suspect.
4. Four mandatory checks for every new setup test
From this case we derived four checks that every new setup test has had to pass since, before its result counts:
- Report the trigger lag: time between the moment the setup is ready and the actual trigger. A median above 10 minutes is an alarm.
- Measure the price-to-level distance at trigger in R, signed in trade direction. A median above zero means the entry is fictitious.
- Time-of-day grid as benchmark, as soon as a new window looks better than the established ones.
- Win-rate plausibility: breakouts with the stop at the opposite side run at 30 to 45%. Considerably more is a reason to check the chain, not to celebrate.
The fix for new tests is trivial — remove the volume condition from the trigger, the break counts in the first candle through the level, the lag drops to zero. The established morning setups were practically unaffected because their lag was already zero; their numbers remain valid. Affected was exclusively every test that had carried the chain into a low-volume window.
5. What this means
A filter that shifts the trigger also shifts the entry. Every confirmation rule — volume, close confirmation, second candle — moves the trigger later. The backtest must use the price at trigger time, not the price at the level. As soon as the two diverge, an edge appears out of nothing.
Results that are too good have a base rate. A setup that is twice as good as anything measured so far is more likely a bug than a finding. Across eleven years of our setup family we had a sense of how good a breakout can be — and ignored it at the first spectacular result.
Stability does not protect you. The phantom edge was positive every year because the volume gap sits in the same place every year. A bug that follows from market structure looks like a structural edge in every decomposition.
6. Limits
- In-sample. Both variants (with and without gate) are measured on the full period; since the result is a bug proof and not a setup finding, an OOS split is not the point here.
- The 30–45% win-rate base rate applies to our breakout mechanics with the stop at the opposite side of the reference candle. Other stop concepts have other base rates; the rule is "know your base rate", not "60% is always wrong".
- Lag and gap were only measured on NQ and Dow, the time-of-day grid on NQ, Dow and SPX pooled. On European indices and FX the size of the effect was not quantified separately.
- Not tested: whether volume confirmation, computed correctly with the price at trigger time, has a positive or negative contribution of its own. This study only shows that the wrong accounting produces a phantom edge — not that volume is worthless as a filter.
📄 Full study as PDF: 6 pages incl. all tables, figures and limits (in German).
Disclaimer: Historical statistics are no guarantee of future market behaviour. This study is not investment advice. Trading involves risk of loss up to total loss.