
Correction, 29 September 2026: Section 1 says that in the morning the breaking candle and the volume candle are the same. For the strongest morning setup that was not the case in 39 to 40% of trades. The negative verdict of this study holds in its direction, because the bias of our older backtest chain is positive, but all R values here come from that chain and their levels are not reliable. Details: The random market as a ruler.
Re-run, 5 October 2026: On the corrected chain the two midday windows in the Nasdaq come to −0.17 and −0.16 R per trade. The negative verdict of this study is confirmed. All numbers: Our own breakout rules, re-measured.
Data basis: NQ, Dow, S&P 500, 2015 – 2026, roughly 8,800 first-break trades (market-days) per window. 10-minute reference candle (18:10–18:20 and 18:30–18:40 Berlin, cross-check with New York anchor 12:10 and 12:30), break in both directions, stop at the opposite side of the candle, entry expires 3 hours after the level is fixed. Exit: trailing stop BE 0.5 / TS 1.0 / step 0.5, hold to end of day as reference. Net of spread and slippage (configuration estimate, real surcharge likely higher). Standard errors clustered by day across the three US indices (see the FTSE hold study for the rationale). Validation anchor: the same calculation chain reproduces a known morning setup at +0.344 R against a target of +0.298 R. No trading recommendation.
The idea comes from everyday chart-watching: around US midday — 12:10 and 12:30 in New York, 18:10 and 18:30 in Berlin — two 10-minute candles form from which the market almost always breaks out. Two breakouts in quick succession invite a coupling hypothesis. If the second breaks in the same direction as the first, that is continuation. If it breaks against it, the first was a trap and the second the resolution. And if both break down, that is an afternoon trend.
Three questions, then: What does each window yield on its own? Does the direction of the first break say anything about the second? And does any combination rescue the second trade?
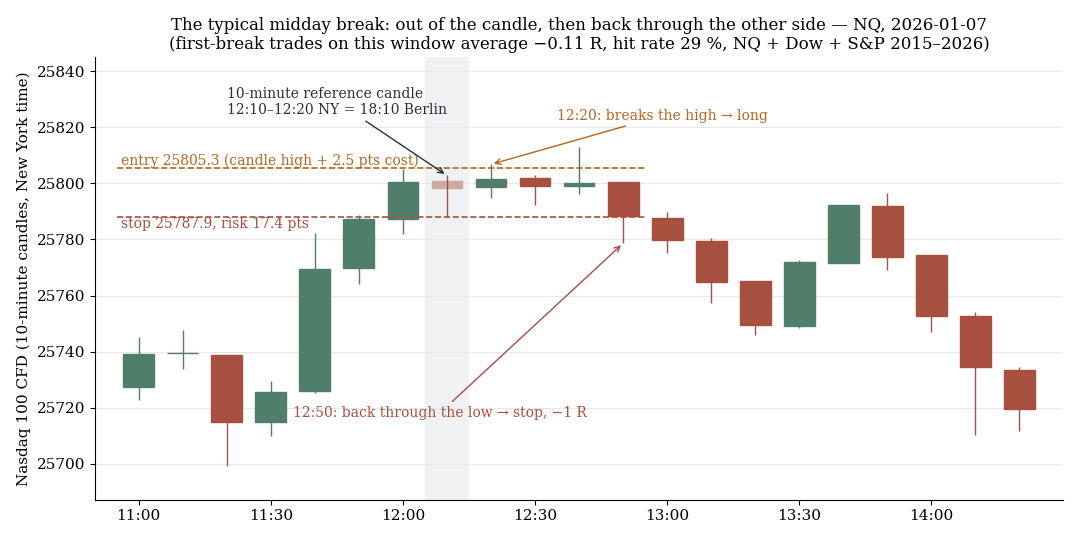
NQ, 10-minute candles: reference candle 12:10 New York, break to the upside, back through the other side 30 minutes later. This is the typical path in this window: 29 % hit rate, −0.11 R on average.
1. The first attempt: +0.90 R, and why it was wrong
The first run through our canonical chain returned +0.90 R at a 60% win rate for both windows, positive in every year. That would have been the best setup in the entire system and would have contradicted everything we know about the US afternoon.
The cause was a volume gate. In the canonical chain a break only counts in the first candle that trades through the level and shows volume above the 20-candle average. In the morning that is the same candle. In the midday lull the volume condition is met, at the median, only 100 minutes after the level break — but the entry was still placed at the old level. Measured: at the trigger, price already stood a median +0.35 R beyond the entry, in 63% of trades. A fictitious entry at a price that no longer existed.
The cross-check settled it: the same mechanics on a grid of clock times across the day. The phantom result tracked the volume profile exactly — 11:10 Berlin +0.48 R, 18:10 +0.90 R, 16:10 −0.03 R. Not a time-window edge, a calculation artefact. With the volume gate switched off, the lag between level break and trigger has a median of zero minutes (mean 2.3, 90th percentile 10). Only on that basis do the following figures hold.
2. Each window on its own: negative
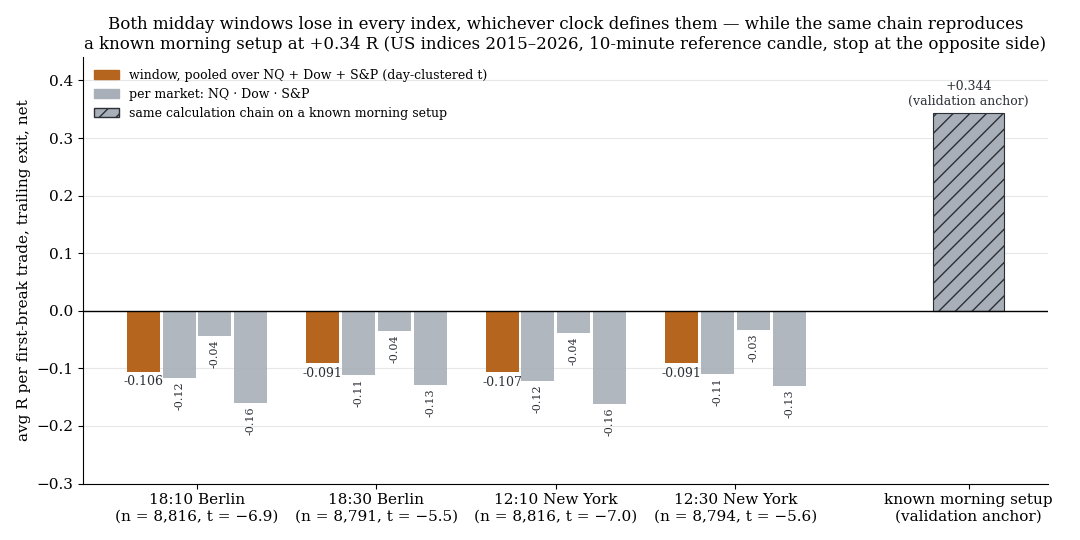
Both midday windows lose in every index, whether defined by the Berlin or the New York clock, while the same calculation chain reproduces the known morning anchor.
| Window (first break, trailing exit) | n | avgR | t | Win rate | NQ | Dow | S&P |
|---|---|---|---|---|---|---|---|
| 18:10 Berlin | 8,816 | −0.106 | −6.9 | 29% | −0.116 | −0.044 | −0.160 |
| 18:30 Berlin | 8,791 | −0.091 | −5.5 | 30% | −0.111 | −0.035 | −0.129 |
| 12:10 New York (cross-check) | 8,816 | −0.107 | −7.0 | 30% | −0.122 | −0.038 | −0.161 |
| 12:30 New York (cross-check) | 8,794 | −0.091 | −5.6 | 30% | −0.110 | −0.034 | −0.130 |
Both windows lose significantly. Long and short sides do not differ (18:10: −0.099 versus −0.114; 18:30: −0.107 versus −0.075). The cross-check with the New York anchor — Berlin and New York switch daylight saving time on different days, so for about three weeks a year 18:10 Berlin is 11:10 rather than 12:10 New York — is identical to the second decimal. So it is not down to the clock-time definition.
The median stop sits at 18.5 and 18.0 points on the NQ, so the brackets are not tiny; the micro-range explanation that applies to 2-minute patterns does not apply here. And the figures are, if anything, too favourable: our configuration costs underestimate the real surcharge by about 0.2 R, which moves both windows close to −0.3 R.
3. Does the first break say anything about the second?
On 8,790 market-days both candles break — practically every day. A 10-minute midday window is always left; the event "break" alone has no selection value.
For the coupling only what was known before the trigger of the second window counts: the first break must precede the second trigger. That holds for 95.2% of pairs (n = 8,368).
| First break | P(second break upwards) | n |
|---|---|---|
| upwards | 52.6% | 4,362 |
| downwards | 52.0% | 4,006 |
| base rate | 52.2% | 8,368 |
Chi-squared = 0.2 — the two directions are independent. The first break contains zero information about the second.
The teaching case sits in the filtering. Computing all 8,790 pairs, including the 4.8% where the second window broke first, gives chi-squared = 10.1 and the coupling looks significant (53.8% versus 50.4%). The entire apparent coupling sits in those 4.8% of pairs with reversed order — there a single move takes out both levels, and the "prediction" merely describes that an impulse breaking two levels runs in one direction. Any coupling question between setups has to be filtered on trigger order, otherwise one measures tautology.
4. Does any combination rescue the second trade?
| First break → second break | n | avgR second trade | t |
|---|---|---|---|
| up → up (same) | 2,293 | −0.123 | −4.2 |
| up → down (against) | 2,069 | −0.075 | −2.2 |
| down → up (against) | 2,084 | −0.093 | −2.8 |
| down → down (same) | 1,922 | −0.077 | −2.5 |
All four cells negative, the differences between them within one standard error. Neither continuation nor reversal of the first break improves the second trade.
There is one table that looks different, and it is the most dangerous in this study. Sorting the first trade by the later direction of the second break, "both same" yields +0.190 R and +0.203 R (win rate 42%), "opposite" −0.417 and −0.419 R (16–17%). That is pure hindsight: at the entry of the first trade the direction of the second break is not available. It only says that a trade wins when the market continues in its direction — and on 49.6% of all days it does not. Whether midday turns into a whipsaw is a coin flip, and on the whipsaw days both trades together lose −0.502 R.
5. What this means
Both midday breakouts are losing propositions on their own, and the order of the two breaks contains no information. This fits a familiar picture: every US afternoon anchor we have measured is negative. Momentum breakouts need volatility, and the midday lull is its opposite.
Two methodological lessons weigh more than the null result. First: a volume gate that does not move the entry along with it produces phantom edges in quiet windows — the quieter the window, the larger the illusion. Anyone seeing an exceptional result in a lull should first measure the lag between level break and trigger. Second: test couplings between setups only with trigger order. Our methodology study describes why a known anchor has to be reproduced before every new test — this case shows that the anchor alone is not enough when the new window has a different volume structure from the anchor.
6. Limits
- In-sample 2015–2026, no out-of-sample split. With two significantly negative windows, overfitting towards "edge" is not a risk; a hidden regime in which it works was not searched for.
- Costs from configuration, not from real fills. The real surcharge makes both windows worse, not better.
- First break per window and day only. Second breaks, re-entries and stop-and-reverse variants are not tested.
- Only the three large US indices, canonical trailing exit. Other exits were not reported here.
- Not tested: conditioning on the morning trend, volatility regime or calendar events; windows other than 18:10 and 18:30.
📄 Full study as PDF: 8 pages incl. all tables, figures and limits (in German).
Disclaimer: Historical statistics are no guarantee of future market behaviour. This study is not investment advice. Trading involves risk of loss up to total loss.