
Note, 29 September 2026: Part of the R values in this study comes from our older backtest chain, which also books positive R on a random market without direction. Those values are too high; results that do not depend on the chain (price statistics, counts) are unaffected. Details: The random market as a ruler.
Re-run, 5 October 2026: The 25 combinations of breakout rule and market from our rulebook have been re-measured on the corrected chain and on real broker ticks. None has an advantage over the random market; after costs the mean is −0.08 R per trade. The affected R values in this study are therefore not proven, the other results are untouched. All numbers: Our own breakout rules, re-measured.
Data basis: FTSE 100. Day level: 2,813 trading days, 29 Apr 2015 – 05 Jun 2026, move from 16:30 London → 16:00 New York, raw in points and ATR-normalised, no spread. Trade level: 22,002 episodes from nine EU-morning-session setups on our episode base, exit trailing stop BE 0.5 / TS 1.0 / step 0.5 (reference: stop-loss only), costs included in the entry, a later exit charged separately with additional costs. Lookahead-free: US strength and FTSE push are known at 16:30 London, tertiles rolling over 250 past days. No trading recommendation.
The question is an everyday one. It is 16:30 in London, the LSE closes, the morning's FTSE trade is in profit. Across the pond the US session has been running for an hour and it is running well. The FTSE has also picked up since midday. Hold until 16:00 New York because Wall Street will carry the index further — or flatten at the London close because nothing happens in the FTSE after that?
Both answers have a plausible story. The Wall Street story sounds better because one remembers the days it worked. We measured it in two stages: first the pure index move at the day level, then the question on real trades with a real exit.
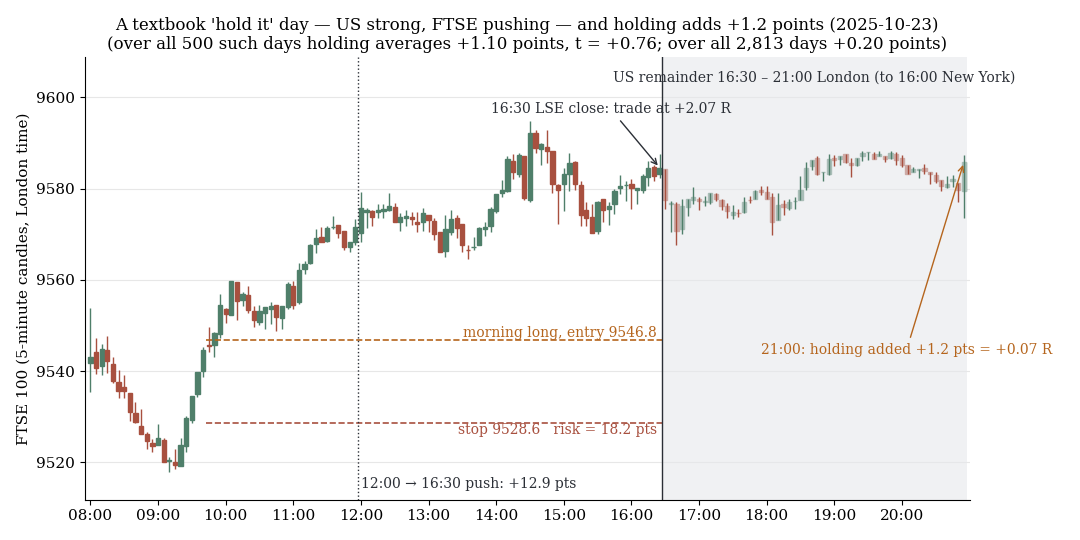
A textbook day for the thesis: strong US afternoon, FTSE push into the 16:30 London close. Holding to 21:00 would have added 1.2 points, that is +0.07 R.
1. Day level: what does holding yield at all?
The benchmark is "always hold": the FTSE's move from 16:30 London to 16:00 New York on all days. It is +0.20 points (n = 2,813, t = +0.38), positive on 51.5% of days. After its own close, the FTSE does nothing on average.
Conditioned on US strength (S&P move since its open, in ATR tertiles) and FTSE push (move since 12:00 London):
| US strength \ FTSE push | weak | medium | strong |
|---|---|---|---|
| strong | +0.025 ATR (n=169, t = +0.7) | +0.003 (n=278, t = +0.1) | +0.009 (n=500, t = +0.6) |
| medium | +0.011 (n=279, t = +0.6) | +0.003 (n=342, t = +0.2) | +0.000 (n=285, t = 0.0) |
| weak | +0.001 (n=520, t = 0.0) | −0.022 (n=290, t = −1.1) | −0.035 (n=150, t = −1.2) |
Not a single cell reaches |t| ≥ 2. The target cell — US strong and push strong — yields +1.10 points (n = 500, t = +0.76), hit rate 52.8% against a 51.5% base rate. Median +1.00 point, the middle 50% of days lie between −12.1 and +14.4 points. The mirror cell (US weak, push weak) yields +0.31 points (n = 520, t = +0.20).
Two robustness checks. First, the push definition: measuring the push from 10:00 instead of 12:00 flips the result to −0.09 points (n = 453); from 14:00 it is +1.37 points (n = 543, t = +1.27). Second, the split: in the first half up to November 2020 the target cell yields −1.33 points (n = 266, t = −0.85), in the second +3.86 points (n = 234, t = +1.53). An effect that flips sign between halves and is significant in neither is the profile of a fresh anomaly, as described in our edge persistence study.
Then costs: the later exit falls into a thinner trading window. With 0.5 points of additional spread, +0.60 points remain of the +1.10; with 1.0 point, +0.10; with 2.0 points, −0.90.
2. Trade level: with a trailing exit the question does not arise
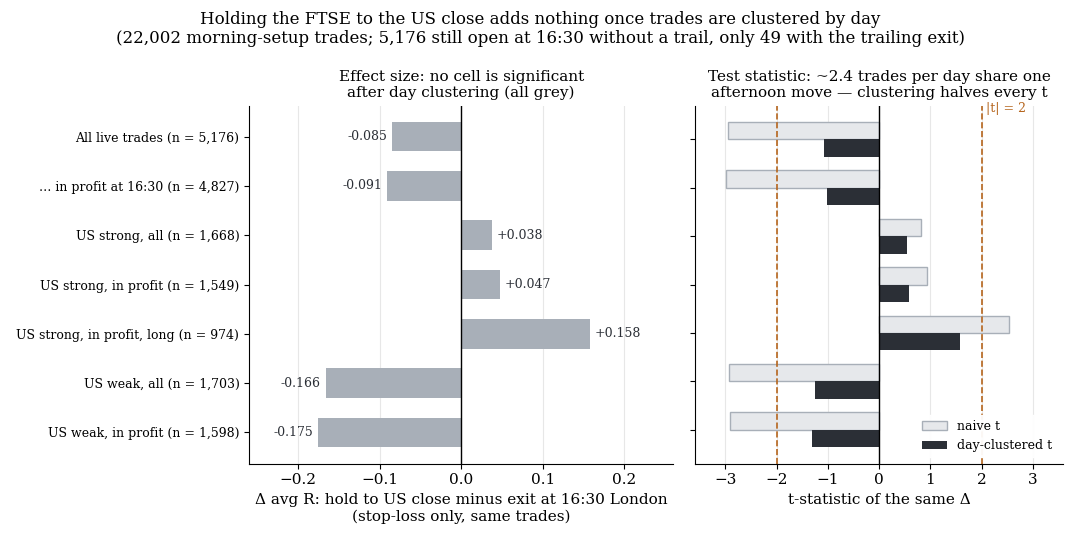
Hold versus exit at 16:30 on identical trades: no cell stays significant after day clustering. About 2.4 trades per day share the same afternoon move, which halves every t.
The episode base holds 22,002 FTSE trades from nine morning-session setups. For each trade the same path was run with three exits: forced close at 16:30 London, forced close at 16:00 New York, status quo. The comparison is paired — same trade, two exits.
First, though, the funnel. Of 22,002 trades, 15,516 trigger in the hour from 08:00 London, a further 4,690 in the hour from 09:00 — 91.8% together. By the LSE close the trailing stop has therefore had more than seven hours. Result: with a trailing exit, 49 of 22,002 trades are still alive at 16:30 London, 0.2%. For a system with a trail, the hold question is practically moot. These 49 trades lose −0.087 R by holding (t = −1.29; day-clustered t = −1.14), and the "US strong" target cell contains 17 trades — too few for any statement.
The question only lives without a trail, with a pure stop-loss. Then 5,176 trades are still open at 16:30:
| Condition (stop-loss only, Δ = hold to US close minus exit at 16:30 London) | n trades | Δ avgR | t naive | n days | Δ daily mean | t clustered |
|---|---|---|---|---|---|---|
| All living trades | 5,176 | −0.085 | −2.95 | 2,170 | −0.042 | −1.07 |
| of which in profit at 16:30 | 4,827 | −0.091 | −2.98 | 2,083 | −0.043 | −1.02 |
| US strong, all | 1,668 | +0.038 | +0.82 | 701 | +0.037 | +0.55 |
| US strong, in profit | 1,549 | +0.047 | +0.93 | 671 | +0.042 | +0.59 |
| US strong, in profit, long | 974 | +0.158 | +2.54 | 433 | +0.140 | +1.57 |
| US weak, all | 1,703 | −0.166 | −2.92 | 705 | −0.096 | −1.25 |
| US weak, in profit | 1,598 | −0.175 | −2.91 | 676 | −0.105 | −1.31 |
Without conditioning, holding costs money. The target cell — US strong, trade in profit, long — is the only one with a positive sign and naively significant. After day clustering it no longer is.
The size of the profit at 16:30 changes nothing (four buckets from 0–0.5 R to above 2 R, all |t| < 1). Not one of the nine setups carries the effect on its own: the differences scatter between −0.162 and +0.138 R, the highest |t| is 1.16. And the split repeats the day-level pattern: up to November 2020 −0.091 R (n = 776, clustered t = −0.21), afterwards +0.185 R (n = 773, naive t = +2.78, clustered t = +1.14).
Costs last. The gross difference for "US strong, in profit" is +0.047 R (n = 1,549, t = +0.93). At a typical stop width of about 15 points, one point corresponds to roughly 0.067 R. Half a point of additional spread for the later exit leaves +0.013 R, a full point turns it into −0.020 R, two points into −0.087 R.
3. The methodological lesson: day clustering in multi-setup markets
The most important finding of this study sits in the rightmost column. On a FTSE day up to nine setups fire. At 16:30 they all sit in the same afternoon move — whatever the US market does between 16:30 London and 16:00 New York hits them together. The naive t-test over trades treats them as independent observations and inflates |t| by roughly the square root of trades per day. Here it is 5,176 trades on 2,170 days, about 2.4 per day.
The result is unambiguous: naive t = −2.95 / +2.54 / −2.92 / +2.78, clustered t = −1.07 / +1.57 / −1.25 / +1.14. Every cell that was naively significant was no longer significant after clustering. Whoever tests over trades instead of days on questions driven by a daily move manufactures significance out of nothing. For us this has been the convention since: form daily means, test over those.
4. What this means
After the London close the FTSE does nothing on average, not even on days when Wall Street is strong and the index itself had a push. This is consistent with our finding that European indices generate most of their drift overnight and price in a US afternoon only in the next morning's gap — see the overnight drift study.
For a system with a trailing exit, the hold question is not a decision but an edge case of 0.2% of trades. For a system with a pure stop-loss, holding without conditioning is a loss and with conditioning a null result that one point of additional spread turns negative.
5. Limits
- In-sample over the full period, no walk-forward split. The halving does not replace it, but shows the instability.
- Tertiles rolling, but the cell choice is ours. The target cell was dictated by the question, not found by search; the other eight cells are reported alongside.
- Costs for the later exit as a sensitivity, not a measurement. How much spread the FTSE actually carries after 16:30 London is not estimated from data here.
- Bid data without real volume, no financing costs (the exit is before midnight, so this does not matter here).
- The setup family is ours. Nine morning setups; whether afternoon entries react differently was not tested.
- Not tested: holding beyond 16:00 New York, conditioning on sector or currency moves (GBP), days with US data releases after 16:30 London.
📄 Full study as PDF: 6 pages incl. all tables, figures and limits (in German).
Disclaimer: Historical statistics are no guarantee of future market behaviour. This study is not investment advice. Trading involves risk of loss up to total loss.