Note, 29 September 2026: The R values in this study come from our older backtest chain. On a random market without direction that chain still books positive R, so the absolute levels here are too high, and comparisons within the chain are not proven either. Why, and what we changed: The random market as a ruler.
Re-run, 5 October 2026: The 25 combinations of breakout rule and market from our rulebook have been re-measured on the corrected chain and on real broker ticks. None has an advantage over the random market; after costs the mean is −0.08 R per trade. Positive R levels and comparisons in this study are therefore not proven. All numbers: Our own breakout rules, re-measured.
Data basis: DAX, FTSE (EU) and NQ, Dow (US), 2015 – 2026, four range-breakout setups of the cash session. 45,045 first breaks and 22,754 second breaks, reconstructed on M1 data with the same logic as our episode basis; costs (spread + slippage) in the entry, exit trailing stop BE 0.5 / TS 1.0 / step 0.5, end of day at the latest. The first-break values reproduce the canonical figures exactly — that is the validation of the reconstruction. No trading recommendation.
A range-breakout setup has two edges. If price breaks the high of the reference candle you go long; if it breaks the low, short. What happens when both break on the same day — first the high, the long is stopped out, then the low?
The obvious answer: the second break is a signal like any other. The range is broken, the direction is now clear, so you trade it. One could even argue it is better: the false breakout trapped the weak hands on the wrong side, and the second break is the real one.
Our episode basis had always discarded that second break — one break per setup and day, the first. Whether that was the right decision had never been measured. This study catches up on it.
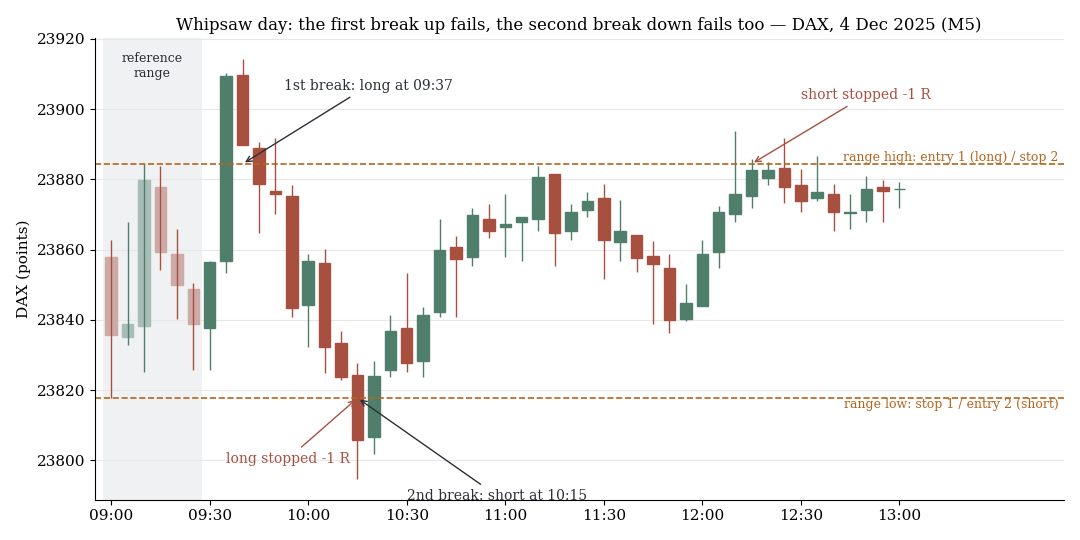
Whipsaw day on the DAX, 5-minute candles: the first break up fails, the second break down fails too. Both trades end at the stop.
1. Method
We rebuilt the episode construction on M1 data and this time kept both triggered sides per setup and day, tagged as first or second break by trigger time. Entry, stop and R path are identical to the canonical logic; the exit is the trailing stop our systems actually run.
The validation is built in: the first-break row has to reproduce the known values of the episode basis. If it does not, the reconstruction cannot be trusted. It does — for example setup D on US at +0.298 R, exactly the canonical anchor.
The four setups: A is the breakout of the 2nd opening candle, B that of the 7th opening candle, C and D are two later range breakouts of the same session. All share the same mechanism: reference range, break of one edge, stop at the opposite edge.
2. US: NQ and Dow
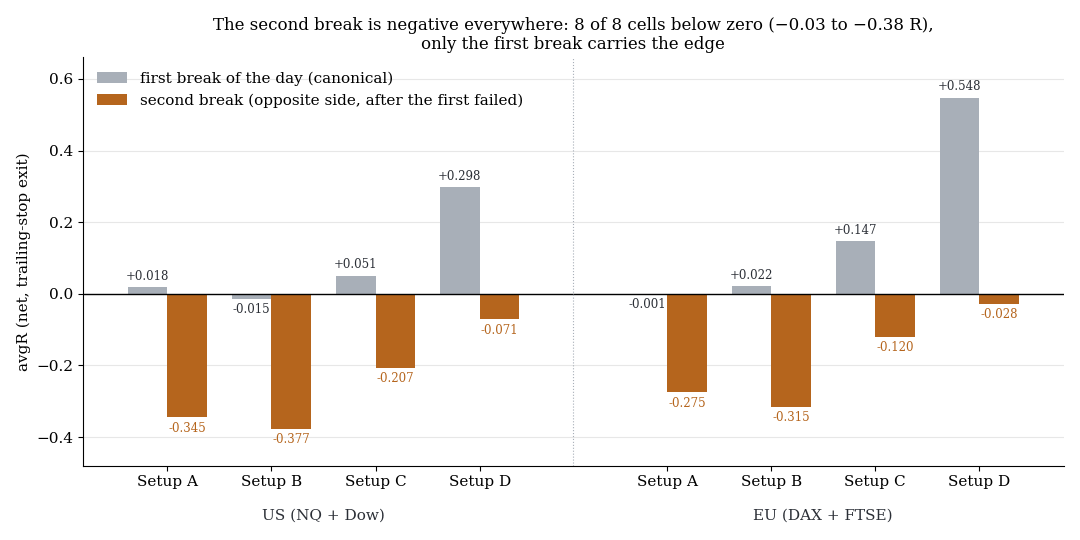
The second break is negative everywhere: eight of eight cells below zero, only the first break carries the edge.
| Setup | First break | Second break | Whipsaw rate |
|---|---|---|---|
| A | +0.018 (n=5,846) | −0.345 (n=2,750) | 47% |
| B | −0.015 (n=5,610) | −0.377 (n=2,409) | 43% |
| C | +0.051 (n=5,638) | −0.207 (n=3,515) | 62% |
| D | +0.298 (n=5,520) | −0.071 (n=2,877) | 52% |
The whipsaw rate is the share of trade days on which the second side breaks as well: between 43 and 62%. That is not an edge case, that is every other day.
The second break is negative in all four rows, and not marginally: A and B lose over a third of an R per trade. Even for D — the only setup with a substantial first-break edge — the second side is negative.
3. EU: DAX and FTSE
| Setup | First break | Second break | Whipsaw rate |
|---|---|---|---|
| A | −0.001 (n=5,759) | −0.275 (n=2,611) | 45% |
| B | +0.022 (n=5,507) | −0.315 (n=2,444) | 44% |
| C | +0.147 (n=5,691) | −0.120 (n=3,469) | 61% |
| D | +0.548 (n=5,474) | −0.028 (n=2,679) | 49% |
Same picture. Eight cells, eight negative signs. The ordering is identical in both market groups: the early setups A and B lose the most on the second break, the late setup D the least — but there is nothing to be had there either.
4. What it costs in total
| Group | First break only | Both breaks | Difference from 2nd break |
|---|---|---|---|
| US (NQ + Dow) | +1,949 R | −839 R | −2,788 R |
| EU (DAX + FTSE) | +3,953 R | +1,973 R | −1,980 R |
In the US the second break destroys more than the entire first-break result and flips the book negative. In Europe it halves it. A system that trades both sides looks profitable on paper — as long as you look at first-break statistics — and bleeds in reality every other day.
5. The mechanism
The second break is not "a signal like any other". By definition it occurs only after the first break has failed. That is not a random sample of all breaks but a selection on a proven chop day: the range has been traversed in both directions, the market has shown that it holds no direction. That is the worst context for a breakout trade, and the numbers are exactly what you would then expect.
The idea "the second break is the real one" is the reversal idea in breakout clothing. We checked it once more in a follow-up measurement with a directional filter: if the first break went against the day's direction and was not traded at all, is the later break in the day's direction any better? No — setup C pooled −0.175 R (t = −7.6, n = 2,711), setup B −0.342 R (t = −16.8, n = 2,334). The filter does not rescue the second break. What matters is not whether the first break was traded, but that it happened.
6. What this means
A rule that shows the same sign in all four setups and both market groups is not a setup detail but a property of range breakouts: a broken side uses up the day for that setup. The first break carries the edge, the second costs — regardless of market, time of day and filter.
The consequence is a one-shot per setup and day. That is also exactly what the episode basis had modelled from the start, without it ever having been justified. Now it is.
What the rule does not say: that the whole day is burnt. Whether a later, different setup gets worse after an early whipsaw is a separate question — and the answer is surprising, see late breakouts after an early whipsaw.
7. Limits
- In-sample over the full history. With eight out of eight cells showing the same sign and |t| far above 2, the risk of a chance finding is low, but there was no OOS split.
- Cost model. Spread and slippage are fixed assumptions per market, not measured tick costs. On chop days with wide spreads the second break is likely even worse in reality.
- One exit regime. All figures use the trailing stop. A different exit changes the magnitude but almost certainly not the sign — a loss of −0.3 R per trade is not an exit artefact.
- Index CFDs only, four setups only. Whether the rule holds for FX or for setups with a different reference logic is untested.
- Day clustering. First and second break of the same day are not independent; the t-statistics of the follow-up measurement carry no cluster correction and are therefore more likely too large than too small.
📄 Full study as PDF: 6 pages incl. all tables, figures and limits (in German).
Disclaimer: Historical statistics are no guarantee of future market behaviour. This study is not investment advice. Trading involves risk of loss up to total loss.