Note, 29 September 2026: The R values in this study come from our older backtest chain. On a random market without direction that chain still books positive R, so the absolute levels here are too high, and comparisons within the chain are not proven either. Why, and what we changed: The random market as a ruler.
Re-run, 5 October 2026: The 25 combinations of breakout rule and market from our rulebook have been re-measured on the corrected chain and on real broker ticks. None has an advantage over the random market; after costs the mean is −0.08 R per trade. Positive R levels and comparisons in this study are therefore not proven. All numbers: Our own breakout rules, re-measured.
Data basis: DAX, FTSE (EU) and NQ, Dow (US), 2015 – 2026, four range-breakout setups of the cash session, 45,045 first-break episodes. Reconstructed on M1 data with the same logic as our episode basis (validated via the first-break anchors), costs (spread + slippage) in the entry, exit trailing stop BE 0.5 / TS 1.0 / step 0.5. The chop signal is known at entry time — lookahead-free. No trading recommendation.
We know from the second-break study that the second side of a range breakout is negative everywhere: when a setup breaks both edges, the first break was a false breakout and the second one costs money. The rule that follows is a one-shot per setup and day.
The obvious generalisation goes one step further. If an early setup has whipsawed, the day has revealed itself as choppy. So one should lock out not just that setup but the whole day — including the later setups that have not even triggered yet. The market has already said it holds no direction.
That sounds reasonable, and it is the kind of rule one likes to build into a trading system because it feels like discipline. We measured it.
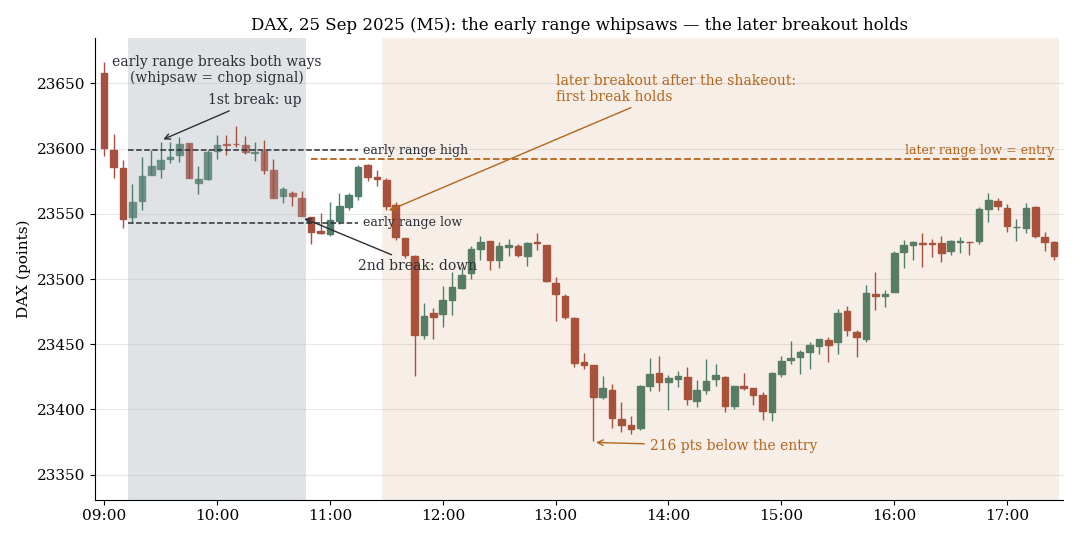
DAX, 5-minute candles: the early range breaks both ways, the later breakout after the shake-out holds. A day lockout would have cut exactly this trade.
1. Definition and lookahead
A first-break trade counts as "after chop" if any other breakout setup on the same day in the same market has already broken both sides, and that setup's second break occurred before this trade's trigger. That is the strict version: at entry time the whipsaw is complete and known. Nothing from the future enters.
We then compare first-break avgR with and without a prior chop signal, per setup and market group. The four setups are named as in the second-break study: A (2nd opening candle) and B (7th opening candle) are the early ones, C and D two later range breakouts of the same session.
2. US: NQ and Dow
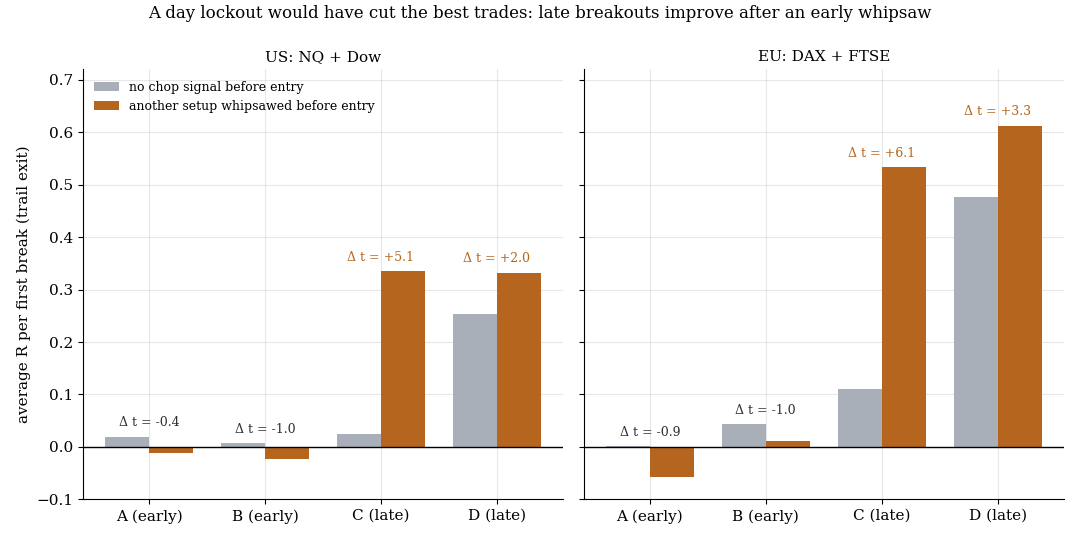
Late breakouts get better after an early whipsaw, not worse, in both regions with t up to +6.1.
| Setup | without chop signal | with prior chop | Difference | Chop rate |
|---|---|---|---|---|
| A (early) | +0.019 (n=5,647) | −0.011 (n=199) | −0.030 (t = −0.4) | 3% |
| B (early) | +0.007 (n=1,461) | −0.023 (n=4,149) | −0.029 (t = −1.0) | 74% |
| C (late) | +0.024 (n=5,147) | +0.335 (n=491) | +0.312 (t = +5.1) | 9% |
| D (late) | +0.254 (n=2,403) | +0.332 (n=3,117) | +0.079 (t = +2.0) | 56% |
The chop rate is the share of trades preceded by another setup's whipsaw. For A it is almost zero — it is the earliest setup, rarely anything happens before it. For B it is 74%, because A runs ahead of it in most cases.
The early setups are unchanged after chop: both differences sit at −0.03 R with |t| ≤ 1, statistically zero. The late setups, on the other hand, get better. Setup C jumps from +0.024 to +0.335 R, a tenfold increase at t = +5.1. Setup D gains +0.079 R, right at the significance threshold.
3. EU: DAX and FTSE
| Setup | without chop signal | with prior chop | Difference | Chop rate |
|---|---|---|---|---|
| A (early) | +0.001 (n=5,576) | −0.058 (n=183) | −0.059 (t = −0.9) | 3% |
| B (early) | +0.043 (n=1,875) | +0.011 (n=3,632) | −0.032 (t = −1.0) | 66% |
| C (late) | +0.111 (n=5,215) | +0.533 (n=476) | +0.422 (t = +6.1) | 8% |
| D (late) | +0.477 (n=2,591) | +0.612 (n=2,883) | +0.134 (t = +3.3) | 53% |
Europe confirms the US picture and sharpens it. Setup C after early chop: +0.533 R at t = +6.1 — the strongest single cell we know for this setup. Setup D, already the strongest setup in the family, gains another +0.134 R (t = +3.3).
In none of the eight cells does a setup degrade significantly after prior chop. In four of eight — all four late ones — it gets significantly or nearly significantly better.
4. The mechanism
Why does a false breakout improve the later trades? The answer lies in what a whipsaw physically does: it runs out the reference range on both sides. The stops on both sides are triggered, the false breaks have happened, the positions of the early breakout traders have been cleaned up.
A later break therefore finds a cleaned-up market. What breaks out afterwards is post-shakeout — the usual source of false breakouts has already been used up. The break is cleaner not despite the early chop but because of it.
This is the flip side of the second-break study. There, the second break of the same setup is negative because it is a re-entry into a range proven to be directionless. Here, the first break of a different, later setup is positive because its reference range only forms after the shakeout. Both findings describe the same day from different points in time.
5. What this means
The rule "the day is showing chop, so skip everything" would have removed the strongest cells of the entire setup book in this sample: 491 US and 476 EU trades of setup C at +0.335 and +0.533 R, plus around 6,000 trades of setup D at +0.33 and +0.61 R. It would have felt like discipline and would have been expensive.
The optimum is what the second-break study demands anyway: a one-shot per setup, not per day. Each setup gets its first break; what other setups did before does not lock it out. A day lockout would not just be superfluous, it would point the wrong way.
One consequence we deliberately did not draw: inverting the effect and deliberately emphasising late breakouts after early chop. That would be an in-sample finding turned into a trading rule; it would first have to survive an OOS check.
6. Limits
- In-sample, no OOS split. The t-values of 5–6 are high, but the effect is measured on the full history and not confirmed on a hold-out.
- Small cells for setup C. 491 and 476 trades after chop are robust for a sign, not for fine calibration of the magnitude.
- The chop definition is one of several. We count only whipsaws of other breakout setups. Other chop definitions (range width, number of direction changes) are untested and could come out differently.
- Day clustering. Trades of the same day are correlated; the t-statistics carry no cluster correction and are more likely too large than too small. At t = 5–6 the sign is unaffected; for D-US (t = 2.0) not necessarily.
- Index CFDs only, one exit regime. Other markets and other exits are not checked.
📄 Full study as PDF: 6 pages incl. all tables, figures and limits (in German).
Disclaimer: Historical statistics are no guarantee of future market behaviour. This study is not investment advice. Trading involves risk of loss up to total loss.