Data basis: Daily data of SPY, QQQ and DIA (Yahoo Finance, regular session) as stand-ins for the S&P 500, Nasdaq 100 and Dow. VIX, VIX9D, VIX3M, VVIX, SKEW and put/call ratio from Cboe. Dealer gamma (GEX) and the dark pool index (DIX) as free daily series from SqueezeMetrics since 2011. Hypotheses and criteria were written down before the first calculation. Search period to the end of 2018 (series start between 2000 and 2011), single holdout 2019 to October 2026 (a window evaluated exactly once, after all rules were fixed). The gamma test ran on Dukascopy minute data of the index CFDs: search period 2015–2022, holdout 2023 to 5 June 2026. Costs: 2 bps per round trip (1 bp = 0.01%), the two gamma rules at market costs of about 2.5 bps, multi-day rules also the overnight swap, the CFD's financing cost. Benchmarks: comparison days without a signal, a VIX-level control, always long, random days. No trading recommendation.
Option markets show how restless traders expect the market to be. The VIX measures the expected swing of the next 30 days, the VIX9D of the next 9, the VIX3M of the next three months. When the short end sits above the long end, the curve is inverted: turbulence now, calm later. The VVIX measures how much the VIX itself is expected to move. Dealer gamma (GEX) estimates whether option dealers dampen moves when hedging (high gamma) or amplify them (low gamma). DIX, SKEW and the put/call ratio are read as buy or crash warnings.
We asked what any of this says about the next session: its width (high minus low), its direction, or both. Width is measured in typical daily ranges, relative to the average of the 20 sessions before (ATR). A value of 1.0 is a typical day. The t-values in brackets show how far a difference lies above the noise, from 2 on it counts as notable.
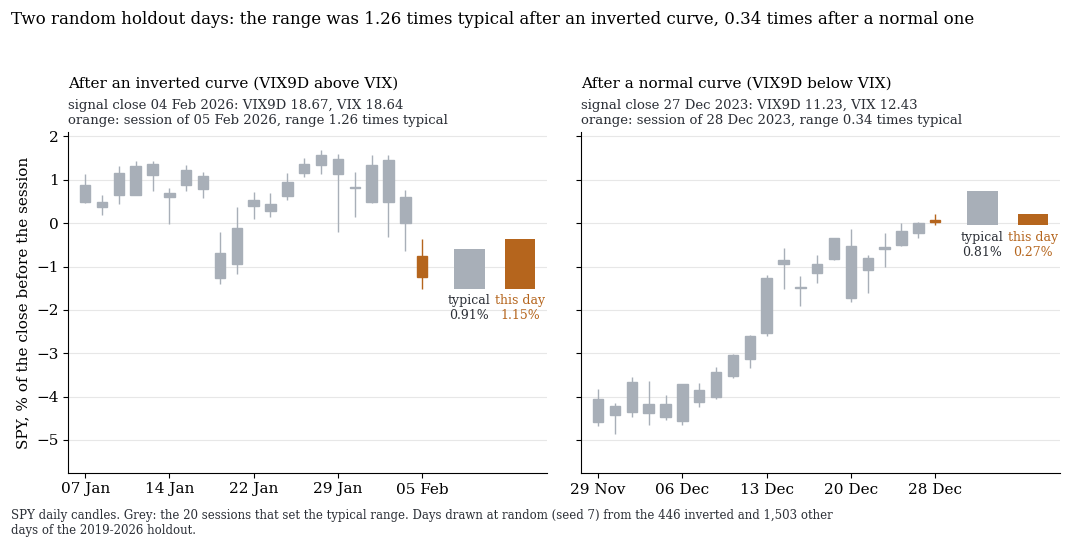
SPY, daily candles. Left: the day after an inverted curve (VIX9D above VIX), right: after a normal one. Orange: the session after the signal. Grey: the 20 sessions before, which set the typical range. Both days were drawn at random (fixed seed 7) from the 2019–2026 holdout, not picked: on 5 February 2026 (VIX9D of 18.67 only just above the VIX of 18.64 the day before) the range was 1.26 times the typical one, on 28 December 2023 it was 0.34 times. The effect is a tendency over many days, not a promise for one.
1. When each value is known
A filter only counts if you know it before the session. We aligned every series with the value that existed at the start of trading:
| Series | Value for day D is available | Used for |
|---|---|---|
| VIX, VIX9D, VIX3M, VVIX (Cboe) | with the close at 16:15 New York time | the US session on D+1 and the DAX on the morning of D+1 |
| Gamma, DIX (SqueezeMetrics) | on the morning of D+1 at about 5:30 New York time | US session on D+1: value of D. DAX: value of D−1 |
| Thirds of VVIX and gamma | only from the 250 values before | rolling, no look-ahead |
2. Term structure and VVIX: wider, and confirmed in the holdout
In the search period we found three states after which the next session comes out wider: VIX9D above VIX, VIX above VIX3M and a VVIX in the top third. The holdout confirmed all three. Dealer gamma is the fourth: an earlier measurement found it in 2015–2022, and we tested it once in the holdout 2023 to June 2026 (section 3).
| State on the previous day | Search period: range wider by (t) | Holdout: wider by (t) | Holdout at equal VIX (t) | Signal days in the holdout |
|---|---|---|---|---|
| VIX9D above VIX | +0.27 (6.7) | +0.26 (5.4) | +0.22 (5.0) | 446 of 1,949 |
| VIX above VIX3M | +0.35 (4.1) | +0.33 (2.6) | +0.27 (2.1) | 132 |
| VVIX in the top third | +0.12 (4.0) | +0.21 (5.2) | +0.18 (4.9) | 687 |
| Gamma, lowest against highest third (search 2015–2022, holdout 2023–06/2026) | +0.25 (6.5) | +0.20 (3.2) | +0.19 (3.0) | 191 against 416 of 839 |
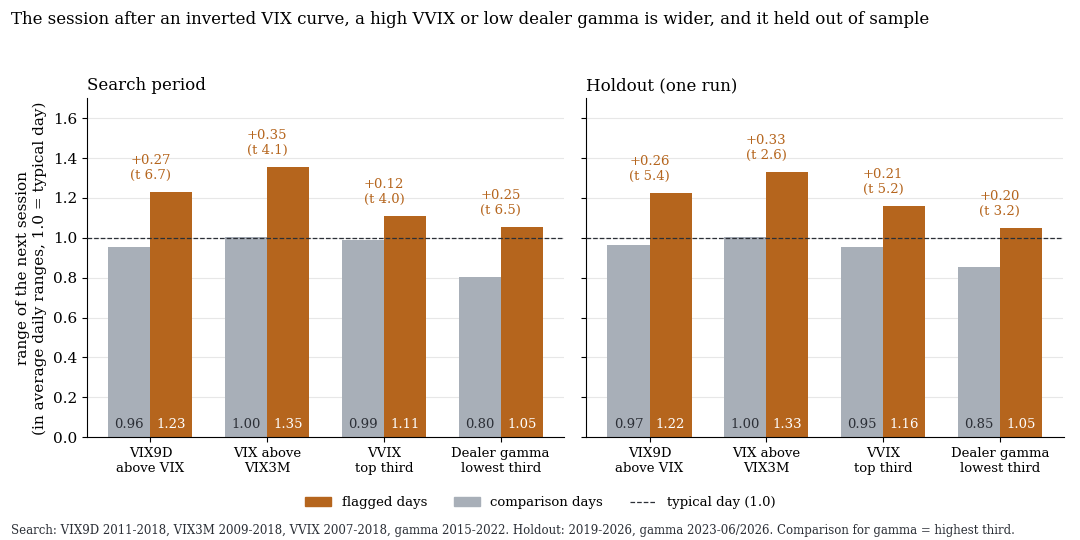
Range of the following session in typical daily ranges (1.0 = typical day). Orange: days with a signal, grey: comparison days, for gamma the highest third. The difference with its t-value is printed above each pair.
The VVIX effect came out even stronger in the holdout than in the search. The DAX the next morning also gets wider: in the holdout +0.23, +0.32 and +0.15 for the three VIX states (t 5.1, 2.7 and 3.9).
A high VIX brings wide days along anyway, so we compared days with the same VIX third. The effect shrinks only slightly.
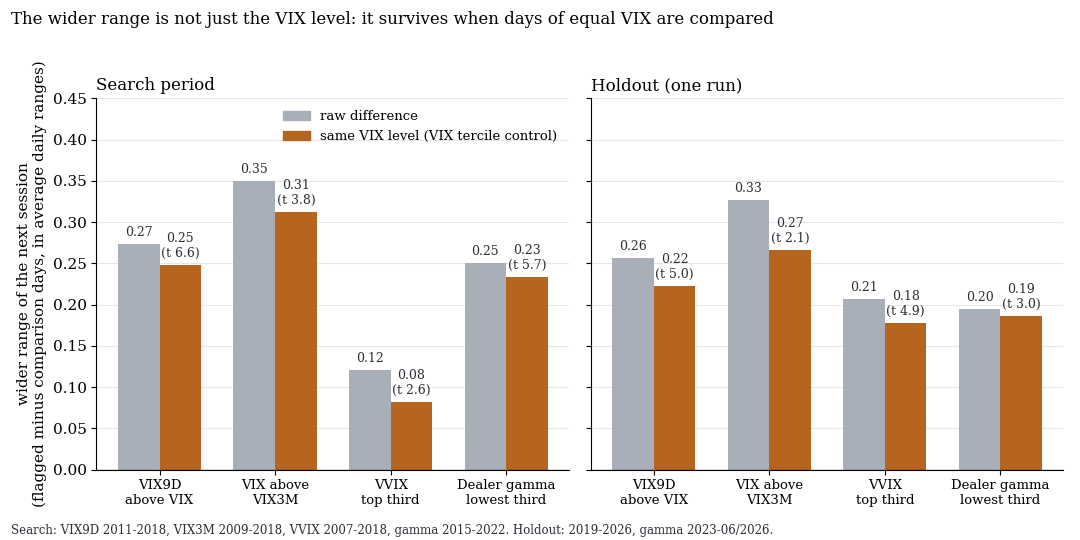
Difference in range between signal and comparison days, raw (grey) and at the same VIX third (orange), with the t-value of the control.
3. Dealer gamma: the same pattern on different data
The lowest gamma third marks days on which dealers tend to amplify moves. In the 2015–2022 search period the next session's range was 0.25 larger there than in the top third (t 6.5). Moves also reverted less: the variance ratio of 30-minute to 5-minute returns (below 1 means mean reverting) was 0.071 higher (t 3.9). The holdout ran once and confirmed both: range +0.20 (t 3.2), variance ratio +0.069 (t 2.0). Gamma is tied to the VIX (the lowest third sat 71% of the time in the top VIX third), yet the effect remains at equal VIX. The trendiness of the day (absolute close minus open, divided by the range) did not hold in the holdout (+0.013, t 0.8).
4. Direction stays at zero
A wider session only helps if you know the direction. After the VIX states trendiness does not change (holdout t 0.2, 0.2 and 0.5): days get wider, not more directional. A session long or short after an inverted curve earns nothing after costs. No t-value exceeds 1.5 in absolute size, and the largest result is +22.0 bps on only 132 signal days (t 1.3).
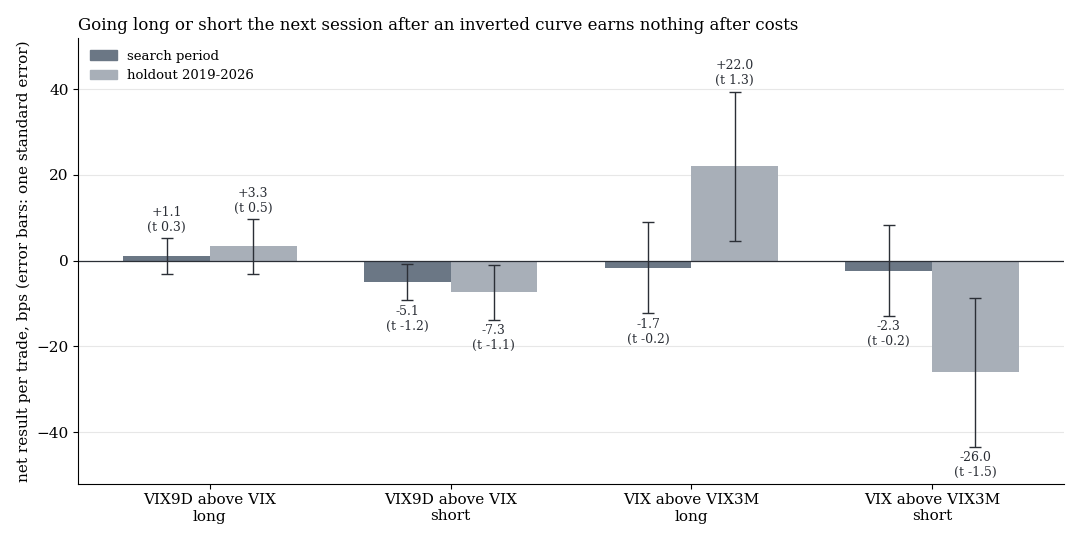
Result of one session long or short after an inverted curve, after 2 bps costs, with one standard error. No bar is more than two standard errors from zero.
Two rules in the lowest gamma third earned nothing in the search period: continuing the day's direction in the last half hour (−0.50 bps, t −0.25) and continuing the first hour to the close (−3.05 bps, t −1.0). They got no holdout run. One trace remained: five days long after VIX above VIX3M made +68.6 bps (t 1.9) in the search and +97.0 bps (t 1.4) in the holdout, in overlapping windows after panic sell-offs. That is no proof.
5. DIX, SKEW and put/call: no timing
| Signal | Search period to 2018 | Holdout 2019–2026 (descriptive) |
|---|---|---|
| DIX in the top third, 20 days long in SPY | +59.0 bps (t 1.6), excess over all days −12.3 bps | +144.2 bps (t 3.2), but better than only 85% of random draws: bull market |
| SKEW in the top tenth, 20 days | −34.5 bps gross against the rest (t −0.9), crash share 14.4% against 19.8% | −36.8 bps gross (t −0.6), crash share 12.5% against 16.5% |
| Equity put/call in the top third, 10 days long | +14.9 bps (t 0.6) | +55.1 bps (t 1.5), excess over all days t 0.2 |
The DIX beat only 39% of random draws in the search period. The vendor threshold of 0.45 is tangled up with time: met on 37% of days in 2011, 0% in 2014 and 96% in 2023. Since 2022 it would mostly mean “always long”. A high SKEW, if anything, announced fewer crashes. A crash here is a drop of at least 5% within 20 days.
What it means
The state of the options market predicts how wide the next day will be, not where it goes. The range grows on average by 0.12 to 0.35 typical daily ranges, in the search and the holdout. That is a filter for the width of the swing, not a trading signal. Whoever ties stops or targets to the expected width has a measurement behind it, but whether that earns more net we did not test. A rule that earns money from the state we did not find: long and short at zero after costs, two gamma rules negative, DIX, SKEW and put/call without timing.
Limits
- Stand-ins and data. The range comes from daily ETF data (index opening prices of earlier years are unusable at Yahoo). The gamma test uses BID minute data that end on 5 June 2026.
- Multiple testing. After the global correction (Benjamini-Hochberg), q, the error probability adjusted for the number of tests, is at most 0.02 with the four filters as their own family and at most 0.08 together with all 32 holdout checks so far.
- Related filters. The four states measure related things and confirm each other only partly. Gamma forms regimes that last for weeks (2020 and 2022, for example), which the standard errors catch only partly.
- Gamma. The vendor's model, assuming dealers bought calls and sold puts, with a definition that is not fully published. In the holdout, gamma sat in the top third on 416 of 839 days.
- DIX, SKEW, put/call. Holdout figures are descriptive, and in the 2019–2026 bull market almost every long rule rises.
- Not tested: switching between breakout and reversion or adjusted stops with these filters, option data with strike resolution, single stocks, futures.
All pattern families of the scan in the overview. Related: dealer gamma in practice, do trend days need a catalyst? and published anomalies net of costs.
📄 Full study as PDF: 8 pages incl. all tables, figures and limits (in German).
Disclaimer: Historical statistics are no guarantee of future market behaviour. This study is not investment advice. Trading carries a risk of loss up to total loss.