Note, 29 September 2026: The R values in this study come from our older backtest chain. On a random market without direction that chain still books positive R, so the absolute levels here are too high, and comparisons within the chain are not proven either. Why, and what we changed: The random market as a ruler.
Re-run, 5 October 2026: The 25 combinations of breakout rule and market from our rulebook have been re-measured on the corrected chain and on real broker ticks. None has an advantage over the random market; after costs the mean is −0.08 R per trade. Positive R levels and comparisons in this study are therefore not proven. All numbers: Our own breakout rules, re-measured.
Data basis: EURUSD, GBPUSD, USDJPY, XAUUSD; breakout over an M15 reference candle, 30 time cells (morning grid 07:15–09:15 Berlin, afternoon grid 04:00–09:30 New York, plus the Asian opens), 2015 – 2026, n ≈ 2,900 per cell. First break per day only, entry cut-off 3 hours. Exit trailing stop BE 0.5 / TS 1.0 / step 0.5, net of spread, slippage and 6 USD/lot round-turn commission. Supplemented by a 10-minute grid 09:00–20:00 Berlin on EURUSD/GBPUSD/XAUUSD (same exit, no commission). The reference candle is complete at the break, no lookahead; anchor check against our episode basis with zero mismatches. No trading recommendation.
The reference-candle breakout is our core mechanism on equity indices. The obvious question: does it work on FX and gold, and if so, at what time of day? The plan was to trade the FX pairs twice daily, in the morning at the London open and in the afternoon ahead of the US open, USDJPY afternoons only.
The measurement overturned the plan in two places. The morning window is dead net of costs, not marginally but in every cell. And the afternoon edge is not where we went looking for it.
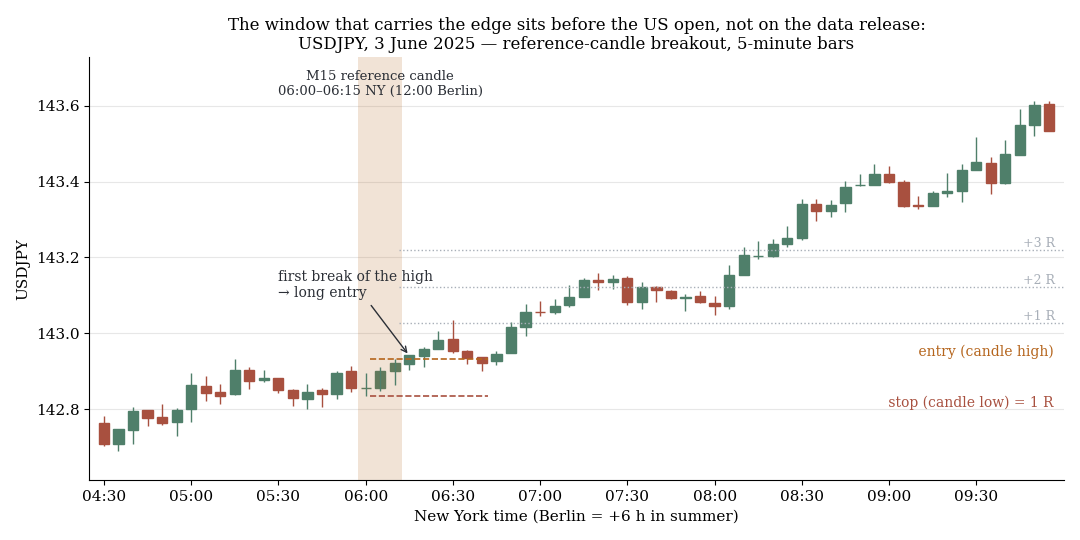
USDJPY, 5-minute candles: M15 reference candle at 06:00 New York, first break to the upside, stop at the candle low. The window that carries the edge sits before the US open, not on the data release.
1. The morning: negative in every cell
Nine reference candles between 07:15 and 09:15 Berlin, each tested on its own. Result for the candle at 08:15, closest to what we had been running, net:
| Market | avgR net | t |
|---|---|---|
| EURUSD | −0.152 | −8.3 |
| GBPUSD | −0.100 | −5.3 |
| USDJPY | −0.138 | −7.0 |
| Gold | negative | — |
Every cell in the morning grid is negative, in both sub-periods (2015–2020 and 2021–2026). The mechanism is commission: at stop distances of 5 to 12 pips, a round turn of 6 USD per lot costs 0.05 to 0.11 R per trade, before any spread. The raw breakout is near zero in the morning, and the toll reliably pushes it below. A setup that looks viable gross can be a losing business net.
2. The mirror image is dead too
If 69% of morning breaks fail, the tempting idea is to trade the opposite: short above the candle, long below, stop at 1 R. We mirrored this analytically on n=5,919 (EURUSD and GBPUSD):
| Variant | avgR | t |
|---|---|---|
| Original breakout | −0.061 | — |
| Anti-breakout | −0.186 | −15.0 |
| Do not trade | 0.000 | — |
All twelve yearly slices negative, hit rate falls from 30.8 to 22.8%. The reason is double costs: relative to the small morning candle the spread is huge, and paying it twice is a 0.345 R handicap up front. The observation "breaks fail often" is correct; the conclusion "so the opposite is profitable" is not. Failed breakouts end in chop, not in a 1 R counter-move.
3. The afternoon: one window, not the expected one
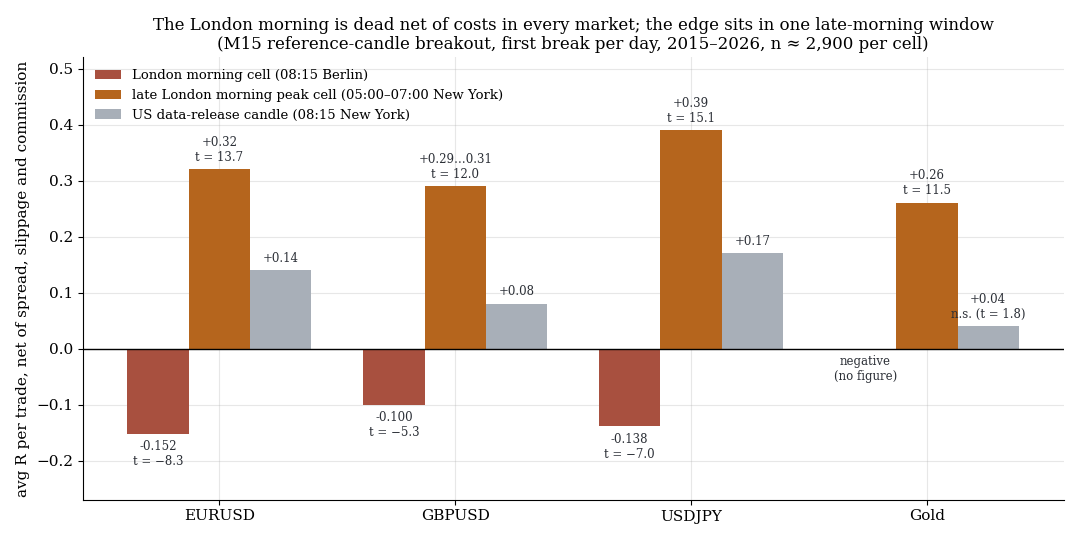
The London morning is dead net of costs in every market; the edge sits in one late-London-morning window, USDJPY strongest.
We had been looking for the candle at 08:15 New York (14:15 Berlin), the time of US data releases. What we found was the peak two hours earlier, in the late London morning (05:00–07:00 New York, 11:00–13:00 Berlin in summer):
| Market | avgR net, peak cell | t |
|---|---|---|
| USDJPY | +0.39 | 15.1 |
| EURUSD | +0.32 | 13.7 |
| GBPUSD | +0.29 to +0.31 | 12.0 |
| Gold | +0.26 | 11.5 |
The hump is broad, positive in both sub-periods on all four markets, and the roll-off is visible on both sides: at 04:00 New York the value is at zero. USDJPY, negative in the morning, is the strongest market in the afternoon.
The original target candle at 08:15 New York is a real but secondary peak: EURUSD +0.14, USDJPY +0.17, GBPUSD +0.08, gold +0.04 (t = 1.8, not significant). A split by calendar shows why: on payrolls Fridays this candle delivers +1.0 to +1.2 R (t ≈ 5), on all other days roughly zero. It is a news setup; the late-morning window carries the everyday result.
A cross-check with a session-end exit at 16:00 New York instead of midnight changes nothing: EURUSD +0.318, GBPUSD +0.269, USDJPY +0.393, gold +0.234. The trail has closed 99.5% of trades before 11:30 New York; the median exit is about 1.5 hours after entry.
4. Asia and the second break
To close the session map: gold at the Shanghai open −0.101 R (t = −4.8), USDJPY at the Tokyo open −0.068 R (t = −3.7), both negative in both sub-periods. Of 30 cells, exactly one window holds.
Trading both sides of the late-morning candle would be disastrous: the candle's second break sits at −0.56 to −0.69 R on all four markets (|t| 23 to 38), with a whipsaw on 54 to 69% of trade days. For gold the total flips from +688 R (first break only) to −709 R (both). That is the index finding from our exit logic study in a more extreme form.
5. Addendum: the 10-minute grid and a measurement trap
A second pass with a continuous 10-minute grid (no commission, hence more optimistic in absolute terms) confirmed the finding for gold and shifted it for the FX pairs. Paired at the day level, midday window 12:00–12:30 against late afternoon 17:30–18:30 Berlin:
| Market | Days | Midday | Afternoon | Δ | t |
|---|---|---|---|---|---|
| Gold | 2,946 | +0.296 | +0.287 | −0.009 | −0.3 |
| EURUSD | 2,509 | +0.402 | +0.821 | +0.419 | +12.3 |
| GBPUSD | 2,614 | +0.381 | +0.630 | +0.249 | +8.2 |
The advantage is not a trend-day artefact: on EURUSD it is almost as large on chop days (+0.373) as on trend days (+0.525), and on GBPUSD it is larger on chop days (+0.281) than on trend days (+0.273). The 17:00–19:00 Berlin hour block also survives the split before and after 2022 (EURUSD 18:00 slot: +0.897 in-sample, +0.729 out-of-sample). Gold, by contrast, has its hump in the 11:00–13:00 Berlin block (peak +0.37 to +0.39) and is worse in the afternoon after a quiet lead-in (−0.166, t = −3.5).
The measurement trap: the first comparison counted several slots of the same day as independent observations and produced t = +24.9 instead of +12.3. Window comparisons must be averaged per day and tested paired; n is the number of days.
6. What this means
- The London morning window is dead net of costs for the reference-candle breakout on FX, and it cannot be rescued by mirroring. Commission relative to small stop distances is the mechanism, not a lack of movement.
- The edge on FX and gold sits ahead of and around the US open, not in the data-release candle. The latter is purely a news-day phenomenon.
- USDJPY is the strongest market in the afternoon after being the weakest in the morning. That argues against "one market, one time" and for measurement per cell.
- Costs in R, not in pips or dollars. 6 USD sounds like nothing; at an 8-pip stop it is 0.075 R per trade, and that decides between positive and negative.
7. Limits
- In-sample over 2015–2026. The sub-period check and the split from 2022 are robustness checks, not walk-forward. The cell choice contains mild selection; the breadth of the hump mitigates that.
- Cost assumptions. Commission of 3 USD per side and the spread constants are broker estimates. The 10-minute grid in section 5 models no commission; there the comparison between times holds, not the absolute level.
- Exit convention. The scan's end of day is local midnight, not a session close; the cross-check with 16:00 New York shows this makes practically no difference.
- Fixed Berlin anchor in the 10-minute grid. FX follows New York; around the daylight-saving switches the window is therefore blurred by an hour. The late-afternoon slots also have fewer episodes (roughly 1,800 to 2,300 instead of 2,950).
- Not tested: pyramiding, timeframes other than M15/M10, silver and other commodities, a hybrid of the late-morning window and the news candle on payrolls Fridays.
📄 Full study as PDF: 8 pages incl. all tables, figures and limits (in German).
Disclaimer: Historical statistics are no guarantee of future market behaviour. This study is not investment advice. Trading involves risk of loss up to total loss.