Note, 29 September 2026: The R values in this study come from our older backtest chain. On a random market without direction that chain still books positive R, so the absolute levels here are too high, and comparisons within the chain are not proven either. Why, and what we changed: The random market as a ruler.
Re-run, 5 October 2026: The 25 combinations of breakout rule and market from our rulebook have been re-measured on the corrected chain and on real broker ticks. None has an advantage over the random market; after costs the mean is −0.08 R per trade. Positive R levels and comparisons in this study are therefore not proven. All numbers: Our own breakout rules, re-measured.
Data basis: SMI 20,433 episodes and CAC 40 20,731 episodes (2,924 trading days), each 05 Jan 2015 – 05 Jun 2026, eight EU-session setups. CA60 (S&P/TSX 60) 984 episodes on 250 trading days, Aug 2025 – Aug 2026, four US-session setups. Exit everywhere trailing stop BE 0.5 / TS 1.0 / step 0.5, net of spread and slippage (calibrated per market from measured bid/ask data). Same signal chain as our episode basis; anchor check on DAX (8/8 setups bit-exact) and DOW/NQ (8/8). No trading recommendation.
The question came up three times in three weeks, each time with a different index: if the setup family works on DAX and FTSE, why not on the SMI, the CAC 40, the Canadian CA60? The session times fit, the setups are defined market-neutrally, and more markets means more trades.
The answer is no three times, but for three different reasons. That is what makes the series instructive: one index fails on the edge question, one on the portfolio, one on costs alone. And the cost question can be answered before any backtest with a single number.
1. The right cost metric: spread as a share of risk
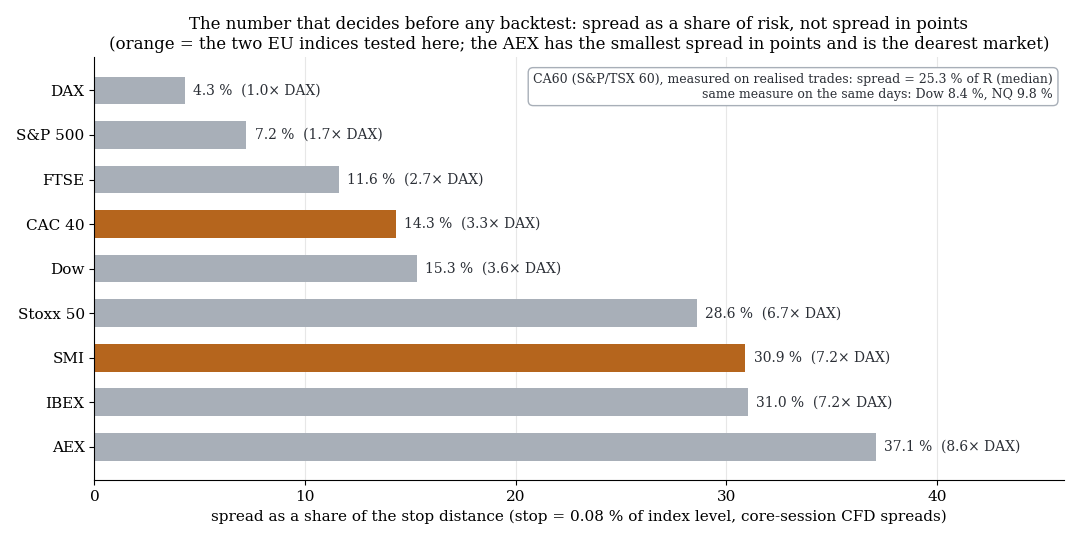
Spread as a share of the stop distance, not in points: the AEX has the smallest spread in points and is the dearest market. SMI and CAC 40 sit at three to seven times the DAX.
The absolute spread in points says nothing. What counts is the spread relative to the setup's stop distance, because every trade pays that toll up front. Our stop distances run from 0.075 to 0.19% of the index level. At a stop distance of 0.08% and the core-session spreads of a common CFD broker:
| Index | Spread toll (spread / stop distance) |
|---|---|
| DAX | 4.3% |
| S&P 500 | 7.2% |
| FTSE | 11.6% |
| CAC 40 | 14.3% |
| Dow | 15.3% |
| Stoxx 50 | 28.6% |
| SMI | 30.9% |
| IBEX | 31.0% |
| AEX | 37.1% |
The AEX has the smallest spread in points on the list and is the most expensive market. Everything from Stoxx 50 down pays seven to nine times the DAX toll before the edge question is even asked. That left the CAC 40 as the only further EU index with an arithmetical chance.
2. SMI: seven of eight setups significantly negative
Measured spread 3.27 points (session median, close to interbank), i.e. 0.0229% of price, roughly three times the DAX. Costs in the test 4.0 points spread plus 1.0 slippage.
| n | avgR | t | |
|---|---|---|---|
| Pooled, eight setups | 20,433 | −0.098 | −13.3 |
| Strongest setup (midday group) | 2,780 | +0.154 | +6.7 |
| Remaining seven setups | 17,653 | −0.090 to −0.172 | −4.7 to −9.2 |
Only the family's strongest setup survives, and even that at a quarter of its DAX value (+0.598). Discarded after one run.
3. CAC 40: the edge exists and hangs on 0.8 spread points
Measured spread 1.00 point (session median and p90 identical, 0.0119% of price). Under our calibration convention, 1.2 points spread plus 0.3 slippage in the test. Because the edge only reaches half the DAX value, we ran costs at three levels:
| Cost level | Spread / slippage | avgR pooled | cluster t |
|---|---|---|---|
| Cost-free | 0 / 0 | +0.324 | +10.1 |
| Base (measured) | 1.2 / 0.3 | +0.078 | +7.7 |
| DAX level | 2.0 / 0.5 | −0.032 | −3.5 |
Costs eat 76% of the raw edge. At DAX-typical costs the whole market flips negative; only the strongest setup stays positive then (+0.143 versus +0.301 at base costs and +0.598 on the DAX).
On identical trading days (2,900 shared days): CAC +0.079, FTSE +0.109, DAX +0.159. In none of the twelve years did the CAC beat the DAX; 2025 stands at +0.028 against +0.162, 2026 so far at +0.027 against +0.193.
4. The actual test: what happens in the portfolio
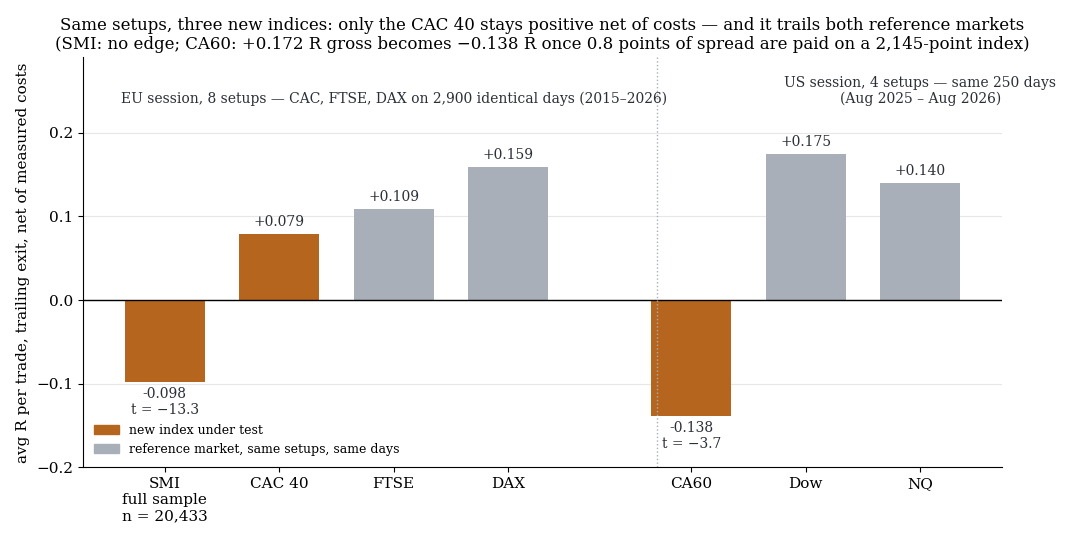
Same setups, three new indices: only the CAC 40 stays positive net of costs and still trails both reference markets. On the CA60, +0.17 R gross becomes −0.14 R net.
A market that is positive on its own is not yet an argument. What matters is whether a CAC trade is an additional bet or the same bet again.
| Pair | Correlation of daily R |
|---|---|
| DAX – FTSE | +0.208 |
| CAC – FTSE | +0.250 |
| CAC – DAX | +0.357 |
The CAC is more redundant to the DAX than the FTSE is. Combining the markets at equal daily risk (mean per day, not sum):
| Combination | Days | avgR/day | R / risk | max drawdown |
|---|---|---|---|---|
| DAX alone | 2,933 | +0.166 | 0.315 | −7.39 |
| DAX + FTSE | 2,943 | +0.139 | 0.330 | −5.45 |
| DAX + FTSE + CAC | 2,944 | +0.119 | 0.309 | −7.05 |
| CAC alone | 2,924 | +0.088 | 0.162 | −11.77 |
The third index lowers the risk-adjusted return from 0.330 to 0.309 and widens the maximum drawdown from −5.45 to −7.05. That answers the original question regardless of whether the stand-alone edge is real.
Striking but not robust: on days when the DAX does not trigger, one CAC setup delivers +0.642 R (n=208, t = 8.7). That is a subsample out of many tested cells and belongs in the "fresh anomaly" category from our edge persistence study, not in a rule.
5. CA60: raw edge present, costs eat everything
The Canadian index was the spread trap from section 1 in its purest form. 0.80 points sounds small; at a price level around 2,145 that is 0.037% of price, against 0.0034% on the DAX. Measured as a share of risk: 25.3% of R at the median (DOW 8.4%, NQ 9.8%).
| Cost level | Spread / slippage | avgR pooled | t |
|---|---|---|---|
| Cost-free | 0 / 0 | +0.172 | +4.3 |
| Half costs | 0.4 / 0.1 | −0.015 | — |
| Base (measured) | 0.8 / 0.2 | −0.138 | −3.7 |
Without costs the setup structure transfers to Toronto: the two setups that are strongest in the US are the strongest here too (+0.314 and +0.230, t = 3.3 and 3.1), the two weaker ones sit at +0.109 and +0.038. With costs all four are negative (−0.028 to −0.193). Break-even would be around 0.45 points total cost; a DOW-like toll would need about 0.25 points. Ten of thirteen months negative; the same days on DOW +0.175 and NQ +0.140, so not a period artefact.
6. What this means
Three indices, three ways to die:
- SMI: no edge. The setups do not work there, regardless of costs.
- CAC 40: edge present but weaker, more expensive and more correlated with the DAX than the FTSE. A net negative in the portfolio.
- CA60: edge present and structurally identical to the US markets, but costs at three times what is tolerable.
The methodological lesson is worth more than the three individual results. First: the spread toll as a share of risk is the number that decides before the backtest. It would have discarded SMI, Stoxx 50, IBEX and AEX without a single test run. Second: a market belongs in the book only if it improves the portfolio, not if it is positive on its own. Third: with thin edges, cost sensitivity belongs in every table. +0.078 R at measured costs and −0.032 R at slightly higher ones is not an edge to put an account on.
Comparable figures for the core markets are in our index comparison of the reference candle.
7. Limits
- In-sample. All three tests run over the full data set without walk-forward. That is less critical for a no than for a yes.
- CA60 only one year. 250 trading days from a terminal export, CFD feed, cash close at 16:00 Toronto (the US setups otherwise run to 17:00 New York). Canadian holidays differ from US holidays.
- Spreads are snapshots. SMI and CAC measured over 30 days close to interbank; CFD brokers sit above that. The broker documents the CAC spread only from 10:00; the early setups trigger before that.
- Portfolio test equal-weighted. In practice setups are selected and capped; the comparison shows the direction, not the exact size.
- Not tested: a reduced selection (only the strongest setup) on the CAC with a live spread measurement in the first trading hour, and the CA60 at a broker with a markedly tighter spread.
📄 Full study as PDF: 7 pages incl. all tables, figures and limits (in German).
Disclaimer: Historical statistics are no guarantee of future market behaviour. This study is not investment advice. Trading involves risk of loss up to total loss.