Data basis: NQ, SPX, Dow, DAX, FTSE; M1 CFD data of the cash session in local time, 05 Jan 2015 – 05 Jun 2026, 2,899 to 2,937 sessions per market. Rule exactly as in SSRN 4416622: direction of the first 5-minute candle, entry at the open of the second candle, stop at the opposite extreme of the first candle, target 10 R or session close. Costs: spread plus slippage in points (NQ 2.5, SPX 0.8, Dow 4.0, DAX 2.5, FTSE 1.5), charged as a share of the initial risk. Benchmark: the identical bracket with random direction, computed as the mean of the long and the short run of the same day. No trading recommendation.
"Can Day Trading Really Be Profitable?" is the most read intraday paper of the last years. Zarattini and Aziz (SSRN 4416622) take the direction of the first 5-minute candle on QQQ, enter at 09:35, stop at the other side of that candle, target ten times the risk or the close. Over 2016 to 2023 they report a 24% hit rate, +0.13 R per trade and, with 4× leverage, 33% a year. The paper charges commission but no spread and no slippage, and it has no out-of-sample period.
We ran the rule, unchanged, on our own minute data. Two answers came out, and they do not contradict each other.
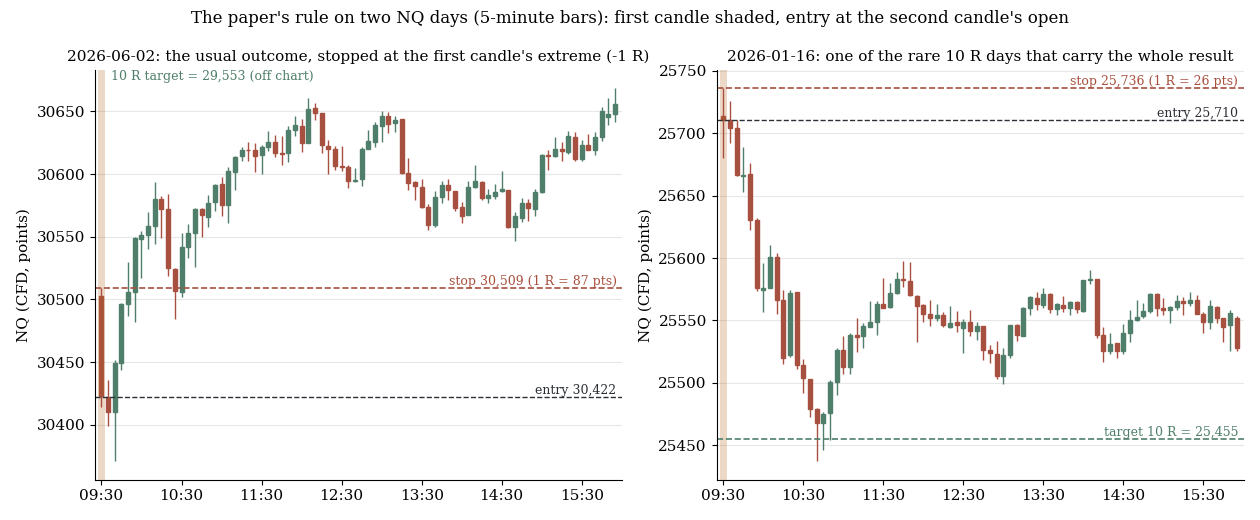
Two NQ days on 5-minute bars, the first candle shaded. 2 Jun 2026 is the usual outcome: the first candle is red, the short is stopped at the candle's high for −1 R. 16 Jan 2026 is one of the 2.4% of days that hit the 10 R target and carry the whole result.
1. Gross, the paper reproduces
First the paper's specification as it stands: every session, no costs, no filter.
| Market | n | avg R (gross) | t | Hit rate | 10 R hits |
|---|---|---|---|---|---|
| NQ | 2,934 | +0.131 | +2.9 | 23.2% | 2.4% |
| SPX | 2,931 | +0.119 | +2.4 | 20.1% | 3.6% |
| Dow | 2,937 | +0.048 | +1.1 | 22.6% | 2.6% |
| DAX | 2,921 | +0.116 | +2.4 | 20.8% | 3.7% |
| FTSE | 2,899 | +0.050 | +1.1 | 23.2% | 2.2% |
On NQ the paper's +0.13 R and 24% come back as +0.131 R and 23.2%, on a different instrument (CFD instead of ETF), a longer period and an independent data set. SPX and DAX land in the same region. That is a clean replication, and it is worth saying so: the paper's arithmetic is right.
The shape of the result is also as described. A hit rate near 20% with a 10 R target means the average trade loses, and two to four days in a hundred pay for everything. On NQ, 2.4% of sessions reach the target.
2. Net, the same rule is a coin flip with a fee
Now the thing the paper leaves out: spread and slippage, charged on every trade as a share of the initial risk. One floor is needed to make that meaningful. When the first candle closes right at its own extreme, the stop is a point or two from the entry and the cost share explodes, so we require the initial risk to be at least twice the round-trip cost. That drops 3 to 13% of sessions; on the remaining days the median cost share is 6 to 12% of the risk.
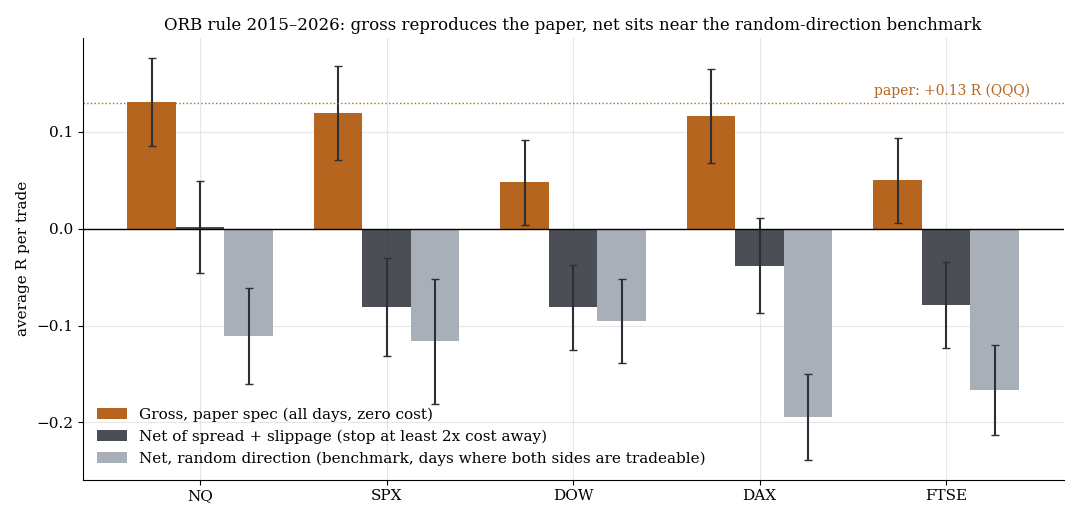
Orange: the paper's specification, all days, zero cost. Dark: the same rule net of spread and slippage. Grey: the identical bracket with random direction, on the days where both sides are tradeable. Error bars are one standard error.
| Market | n | Gross | Net | SE | t (net) | Hit rate |
|---|---|---|---|---|---|---|
| NQ | 2,638 | +0.147 | +0.002 | 0.047 | 0.0 | 24.3% |
| SPX | 2,564 | +0.113 | −0.081 | 0.051 | −1.6 | 20.9% |
| Dow | 2,835 | +0.041 | −0.081 | 0.044 | −1.9 | 23.0% |
| DAX | 2,835 | +0.100 | −0.038 | 0.049 | −0.8 | 21.0% |
| FTSE | 2,796 | +0.069 | −0.079 | 0.044 | −1.8 | 23.9% |
Net of costs, no market is distinguishable from zero and four of five are negative. NQ, the paper's own market, ends at +0.002 R.
That leaves the question whether the first candle carries any information at all, or whether the gross number is just what an M1 bracket with a 10 R target produces on any direction. For that we run the identical bracket long and short on every day and take the mean, the return a coin flip would earn. This benchmark needs both sides tradeable, which is not the case when the first candle closes near its own extreme, so it can only be built on 31 to 60% of sessions, and only the difference between rule and random is a clean number on that subset.
| Market | n (both sides tradeable) | Rule, net | Random direction, net | Δ rule − random | t (Δ) |
|---|---|---|---|---|---|
| NQ | 1,323 | +0.013 | −0.111 | +0.124 | +2.1 |
| SPX | 923 | −0.025 | −0.116 | +0.092 | +1.2 |
| Dow | 1,755 | −0.075 | −0.096 | +0.021 | +0.4 |
| DAX | 1,725 | −0.066 | −0.194 | +0.128 | +2.5 |
| FTSE | 1,449 | −0.060 | −0.166 | +0.106 | +2.0 |
If the first candle carried nothing, the rule would sit on the random bar. It does not: in NQ, DAX and FTSE the rule beats random direction by +0.10 to +0.13 R at |t| ≥ 2, in SPX by +0.09 R at t = 1.2, in the Dow by nothing. The first 5-minute candle does know something about the next hours. It knows roughly 0.1 R worth, and 0.1 R is what a 2.5-point round trip costs on a 25-point stop.
3. By epoch: the low-volatility years are negative everywhere
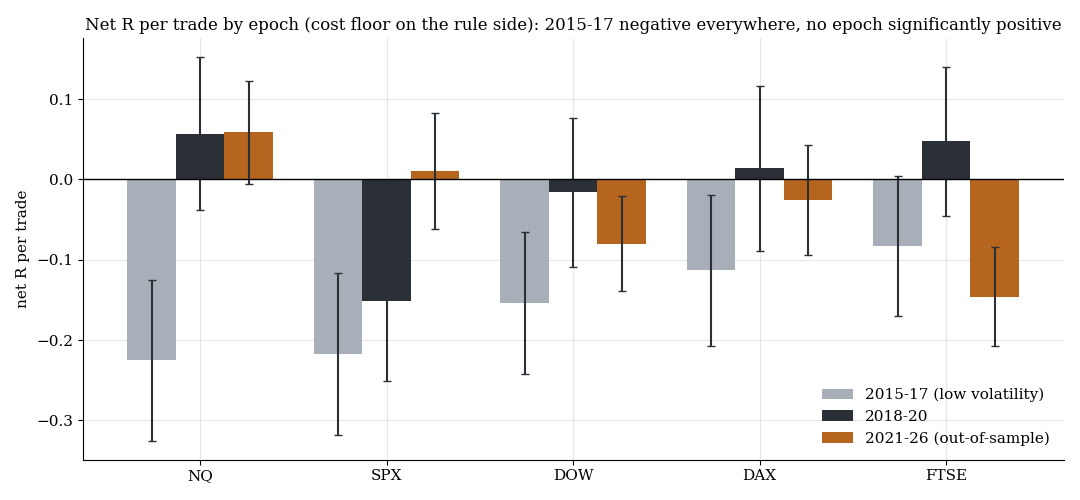
Net R per trade by market and period, cost floor on the rule side. 2021–2026 is out of sample relative to the paper's 2016–2023 window.
| Market | 2015–17 (low vol) | 2018–20 | 2021–26 (out of sample) | Δ vs random, 2021–26 |
|---|---|---|---|---|
| NQ | −0.225 (n=524, t −2.2) | +0.057 (n=730) | +0.058 (n=1,384, t +0.9) | +0.128 (t +1.8) |
| SPX | −0.218 (n=541, t −2.2) | −0.152 (n=677, t −1.5) | +0.010 (n=1,346) | +0.119 (t +1.3) |
| Dow | −0.154 (n=698, t −1.7) | −0.016 (n=749) | −0.080 (n=1,388, t −1.3) | +0.016 (t +0.3) |
| DAX | −0.113 (n=735, t −1.2) | +0.014 (n=732) | −0.026 (n=1,368) | +0.133 (t +2.0) |
| FTSE | −0.083 (n=716) | +0.047 (n=737) | −0.146 (n=1,343, t −2.4) | +0.112 (t +1.5) |
Three things stand out. 2015 to 2017 is negative in every market and significantly so in NQ and SPX; those are the years breakouts did not travel, the regime we documented in the volatility regime study, and the paper's sample starts in 2016 and contains 2018, 2020 and 2022. No market and no epoch is significantly positive net; the best cells are NQ and SPX out of sample at +0.06 and +0.01 R. And the direction information, the Δ against random, is still there out of sample in NQ, SPX, DAX and FTSE, and still not large enough to pay for the trade.
4. Where the 33% a year comes from
The paper's headline number is not a different measurement. It is the same +0.13 R, multiplied through three assumptions that a retail account does not get.
Zero spread and slippage. The stop sits at the extreme of the first candle. On the median NQ day since 2021 that is 39 points from the entry; a 2.5-point round trip is 6% of the risk on every trade, on a rule with a 20% hit rate, and on SPX and FTSE the share is 12%. The paper's own robustness section reports a variant with a tighter stop at 9,350% and calls it unrealistic without slippage. The base case has the same problem in a milder dose.
4× leverage on a 20% hit rate. Leverage multiplies the mean and the drawdown alike. With one winner in five and 2 to 4% of trades doing the work, losing streaks of ten and more are routine. On a funded account with a daily loss limit that structure does not survive the month, independent of the expectancy.
A sample without the dead years. 2016 to 2023 skips 2015 and 2017 and contains the three most volatile years of the decade. Our 2015–17 cells show what the rule does when volatility is absent: −0.08 to −0.23 R in every market.
5. What this means
The paper is right about the pattern and wrong about the trade. The colour of the first 5-minute candle carries a small, real directional edge against a random-direction benchmark, about +0.1 R, present in four of five indices and still there out of sample. That is a finding, and it agrees with our first-candle study: the candle says little about the rest of the day, but "little" is not "nothing" once you measure it against the right benchmark.
It is not a strategy on a CFD account. The edge is the size of the spread. A rule that needs zero costs, four times leverage and a hand-picked decade to show 33% a year shows, at retail costs, +0.002 R on its best market and a loss on the other four.
For anyone who wants to build on it, the useful part is the benchmark method, not the rule. An M1 bracket simulation has discretisation bias; the absolute gross numbers in table 1 are optimistic for that reason alone. Only the difference between the rule and the same bracket with random direction is a clean measurement, and that difference is what remains after everything else is stripped away.
6. Limits
- CFD data, not QQQ. The index CFD trades around the clock, so "first candle after the open" is the first cash-session candle, not the first candle after an overnight halt. The paper's overnight gap enters our candle differently. Gross replication to two decimals suggests the difference is small; it is not zero.
- Costs of today applied to 2015 prices. Spread and slippage in points are current Pepperstone levels. In 2015 the indices traded lower and the same points were a larger share of a smaller candle, so the early years are overcharged. The 2021–2026 cells are the fair ones.
- Conservative fills. A minute bar that touches both stop and target counts as a stop. That hurts the rule on its best days and is part of why gross is a lower bound.
- The random benchmark lives on a subset. It needs both brackets tradeable and therefore excludes the days where the first candle closed near its own extreme. The rule's net result on that subset (+0.013 to −0.075 R) is close to its result on all days, so the subset is not obviously biased, but Δ is a statement about 31 to 60% of sessions.
- No leverage, no sizing, no compounding. We measure R per trade. Annual returns depend on choices the paper makes and we do not reproduce.
- One specification. The paper's second version (SSRN 4729284, US single stocks ranked by relative volume, stop at 10% of ATR) is a different rule on a different universe and was not tested here.
- Δ against random at t ≈ 2 in three markets comes out of about 30 t-values computed across markets and epochs. One to two hits at |t| ≥ 2 are the random expectation; three, all in the same direction and stable out of sample, are more than that but not proof.
Disclaimer: Historical statistics are no guarantee of future market behaviour. This study is not investment advice. Trading involves risk of loss up to total loss.