Data basis: DAX, FTSE, Dow, NQ; M1 data of the cash session in local time (session end DAX 17:30, FTSE 16:30, US 16:00), 05 Jan 2015 – 05 Jun 2026, 2,907 to 2,935 trading days per market. Windows of 5, 10 and 15 minutes after the open. Pure price statistics, no trades, no costs. Benchmark: independence expectation from the base rates, t = (observed − expected) / SE. Lookahead-free: the candle is known at open + N, the remainder starts exactly there. No trading recommendation.
It is one of the most common pieces of chart wisdom: "As the first candle goes, so goes the day." First 15-minute candle green, day green. First candle red, day red. Anyone who checks the claim by laying candle direction next to day direction finds it confirmed — clearly, and across every market.
The confirmation is real and still worthless. The reason is a measurement error so obvious it gets overlooked: the first candle is part of the day. If the candle makes +0.3% and the day closes +0.1%, the direction "matches" — even though the market fell after the candle. The question that matters is a different one: does the first candle predict how the day runs from its own end onwards? We measured both.
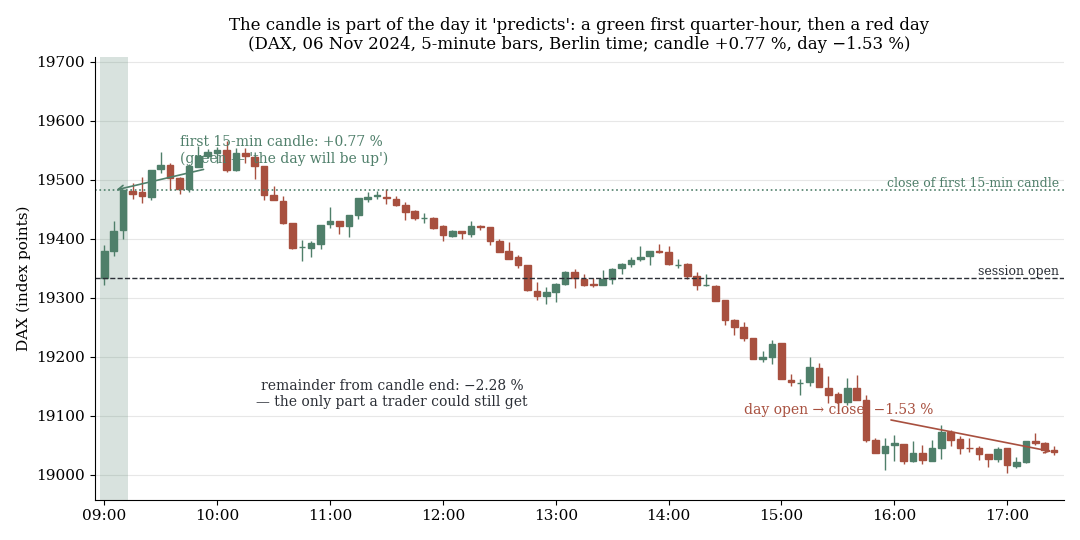
DAX, 5-minute candles: green first quarter-hour (+0.77 %), red day (−1.53 %). The candle is part of the day; what a trader can still get from the candle end is the remainder.
1. The literal question: candle and day in the same direction
Day = open → session close. First candle = open → close after N minutes. The match is set against the independence expectation, which corrects for the long bias in the base rates (day > 0 on 53.2 to 55.2% of days) and for the skewed candle distribution.
| Market | Window | n days | Match | expected | t |
|---|---|---|---|---|---|
| DAX | 5 min | 2,920 | 57.9% | 49.9% | +8.7 |
| DAX | 15 min | 2,923 | 60.7% | 49.9% | +11.9 |
| FTSE | 5 min | 2,893 | 59.3% | 50.0% | +10.1 |
| FTSE | 15 min | 2,899 | 62.3% | 50.0% | +13.7 |
| Dow | 5 min | 2,934 | 58.4% | 50.2% | +9.0 |
| Dow | 15 min | 2,935 | 62.4% | 50.1% | +13.7 |
| NQ | 5 min | 2,931 | 58.1% | 50.1% | +8.7 |
| NQ | 15 min | 2,933 | 63.7% | 50.3% | +15.1 |
The claim holds literally, in every market, with t-values far above the significance convention of |t| ≥ 2. Conditionally: after a positive candle the day closes positive on 61.4 to 68.1% of days, after a negative candle it closes negative on 52.9 to 59.3%. The match rises with candle length — 5 → 10 → 15 minutes — and that is the first hint at the mechanism: the larger the candle's share of the day, the more often the direction "matches".
2. The tradeable question: the day from the candle's end
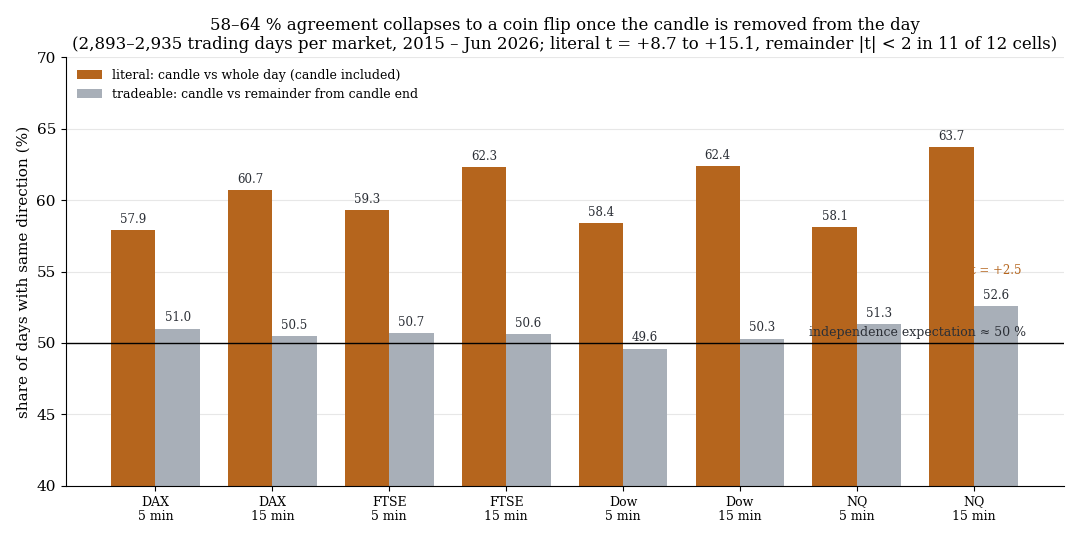
58 to 64 % agreement collapses to a coin flip once the candle is removed from the day. Only NQ 15 minutes stays just above the threshold.
Remainder = close after N minutes → session close. That is the stretch a trader can still capture after the candle. Same calculation, same benchmark.
| Market | Window | Remainder match | expected | t | avg remainder after C+ | after C− |
|---|---|---|---|---|---|---|
| DAX | 5 min | 51.0% | 49.9% | +1.2 | +3.7 bp | −1.6 bp |
| DAX | 15 min | 50.5% | 49.9% | +0.6 | +1.6 bp | +0.5 bp |
| FTSE | 5 min | 50.7% | 50.0% | +0.7 | +2.4 bp | −0.6 bp |
| FTSE | 15 min | 50.6% | 50.0% | +0.6 | +2.2 bp | −1.7 bp |
| Dow | 5 min | 49.6% | 50.2% | −0.7 | +1.1 bp | +2.7 bp |
| Dow | 15 min | 50.3% | 50.1% | +0.2 | +2.5 bp | +2.5 bp |
| NQ | 5 min | 51.3% | 50.1% | +1.3 | +5.2 bp | +0.2 bp |
| NQ | 15 min | 52.6% | 50.3% | +2.5 | +7.5 bp | −1.7 bp |
Everything collapses to a coin flip. Eleven of twelve market-window cells sit at |t| < 2, with remainder matches between 49.6 and 52.6%. The average remainder return differs between positive and negative candles by a few basis points — on the Dow, after a negative 15-minute candle, exactly as much as after a positive one (+2.5 bp in both cases). The 58 to 64% from section 1 were the candle confirming itself.
That the remainder hit rates also sit slightly above 50% is not a remainder effect but the long bias: the average remainder is positive in almost every cell regardless of candle colour. Why the intraday drift is nonetheless not tradeable is covered in our overnight drift study — which also contains the base rates the benchmark here is built from.
3. The one exception: NQ, 15 minutes
The only cell with |t| ≥ 2 is the 15-minute candle on NQ: remainder match 52.6% (t = +2.5), average remainder +7.5 bp after a positive versus −1.7 bp after a negative candle (t of the difference = 2.5). The time split shows where it comes from:
| NQ 15 min | n days | Remainder match | t | avg remainder C+ | C− |
|---|---|---|---|---|---|
| 2015–2020 | 1,538 | 50.7% | +0.3 | +4.8 bp | +0.3 bp |
| 2021–2026 | 1,395 | 54.6% | +3.3 | +10.4 bp | −3.8 bp |
The effect is carried entirely by 2021 to 2026. That fits a momentum character of NQ in this epoch, but it is one cell out of 36 (four markets × three windows × three periods), selected in-sample, without an out-of-sample test. Across all 36 cells, four reach |t| ≥ 2 — besides the two NQ 15-minute cells, NQ 10 minutes 2021–2026 (52.8%, t = +2.0) and FTSE 10 minutes 2015–2020 (53.1%, t = +2.5); the FTSE cell falls back to 48.5% (t = −1.3) in 2021–2026. We file NQ-15 as suggestive, not as a finding.
The Dow since 2021 shows, if anything, the opposite: after a negative first candle the remainder is on average positive (+5.3 / +4.7 / +4.7 bp for 5/10/15 minutes, remainder match 48.1 to 49.6%, no cell significant). That is consistent with dip buying and with the Dow's long advantage from the drift study — but equally not robust.
4. What this means
"The first candle sets the day" is description, not prediction. The sentence correctly describes that a day starting at +0.3% ends positive more often than one starting at −0.3% — because the +0.3% is already in it. About the remaining hours the candle says nothing. Using candle colour as a direction filter for the rest of the day filters noise.
We have found the same structure in another pattern before: the pin bar in the first five minutes is a pure proxy for where price stands after five minutes; the shape carries no information of its own. Candle patterns at the open are summaries of what has already happened.
What does carry directional information is not the colour of the candle but its break: price moving beyond the candle's extreme, measured as an event with a stop and an exit — see the trend-day detection via the second opening candle. The difference is not cosmetic. The colour is known at the candle's end and free; the break is a price the market has to pay afterwards.
Methodologically the lesson stands: any comparison in which the predictor is part of the target is mechanically significant. t-values of 9 to 15 told us nothing about the market here, only about the overlap of two intervals. The benchmark has to remove the overlap, otherwise you are measuring arithmetic.
5. Limits
- Pure price statistics. No trades, no stops, no costs. A remainder return of a few basis points would not be tradeable after spread anyway.
- CFD sessions. Session defined by local clock time, no exchange auction prices; days with data gaps in the first window discarded, |daily return| > 10% excluded as data errors, dojis (candle exactly 0) removed from the conditional rates.
- NQ 15-minute cell selected in-sample, no out-of-sample test; four of 36 cells above |t| ≥ 2 is not a strong signal given the number of tests.
- Direction only. Not tested: candle size relative to the daily range, combination with gap or pre-open move, other windows (30 minutes, 60 minutes).
- Four indices. FX and commodities not included.
📄 Full study as PDF: 6 pages incl. all tables, figures and limits (in German).
Disclaimer: Historical statistics are no guarantee of future market behaviour. This study is not investment advice. Trading involves risk of loss up to total loss.