Note, 29 September 2026: The R values in this study come from our older backtest chain. On a random market without direction that chain still books positive R, so the absolute levels here are too high, and comparisons within the chain are not proven either. Why, and what we changed: The random market as a ruler.
Re-run, 5 October 2026: The 25 combinations of breakout rule and market from our rulebook have been re-measured on the corrected chain and on real broker ticks. None has an advantage over the random market; after costs the mean is −0.08 R per trade. Positive R levels and comparisons in this study are therefore not proven. All numbers: Our own breakout rules, re-measured.
Data basis: 11,714 episodes of an early breakout setup over a short reference candle before the cash open, once each in the EU and US session, on DAX, FTSE, NQ and DOW, 2015 – 2026. Exit trailing stop BE 0.5 / TS 1.0 / step 0.5, net of spread and slippage at entry. 5-minute paths reconstructed from M1 and checked in groups of three bit-exactly against our episode basis (maximum deviation 0). The pin bar is detected at the close of the first 5-minute candle; every rule acts no earlier than that, no lookahead. No trading recommendation.
The observation came from a live chart: the breakout triggers, and the first 5-minute candle after it is a pin bar, a long wick in the break direction, close near the low. The move was rejected immediately. Should one then move to break-even faster, or close outright?
The question is a good one because it states a tradeable hunch precisely. The answer has two parts that appear to contradict each other: the pin bar really is a strong classifier, and yet no rule that reacts to it helps.
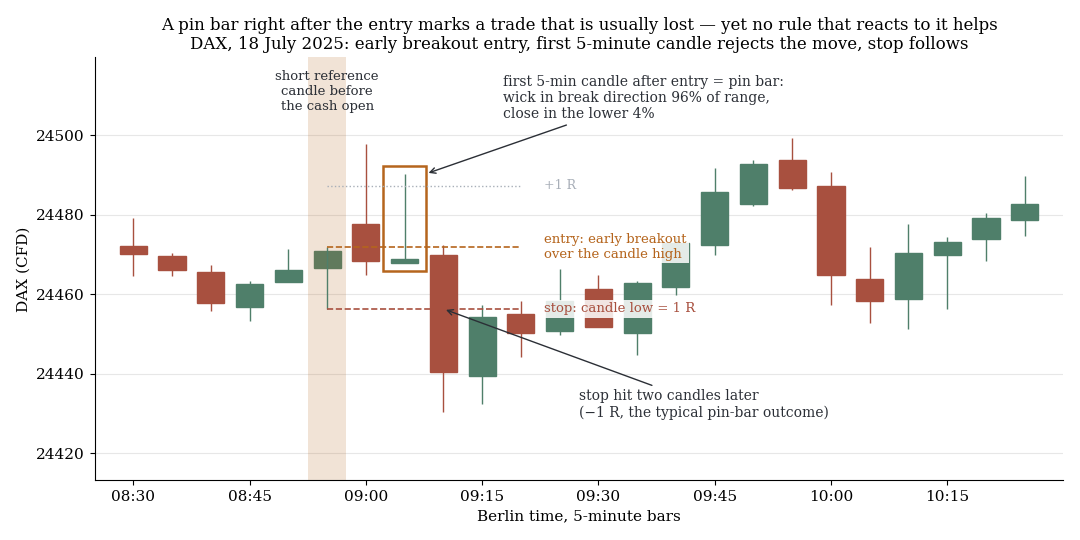
DAX, 5-minute candles: early breakout entry, the first candle after it is a pin bar with the wick in the break direction, two candles later the stop is hit. The typical outcome of this candle.
1. The pin bar separates spectacularly
Definition: close in the lower third of the candle's range and wick in the break direction at least 30% of the range. That flags 16.9% of trades. Result on the trail's regular 15-minute grid:
| First 5-min candle | n | avgR | Hit rate |
|---|---|---|---|
| Pin bar | 1,983 | −0.599 | 13.3% |
| no pin bar | 9,731 | +0.251 | 39.6% |
Separation 0.850 R, t = −31.9. A trade that starts like this is lost on average. The family as a whole sits at +0.107 R; the pin trades visibly drag it down.
2. But only as a proxy
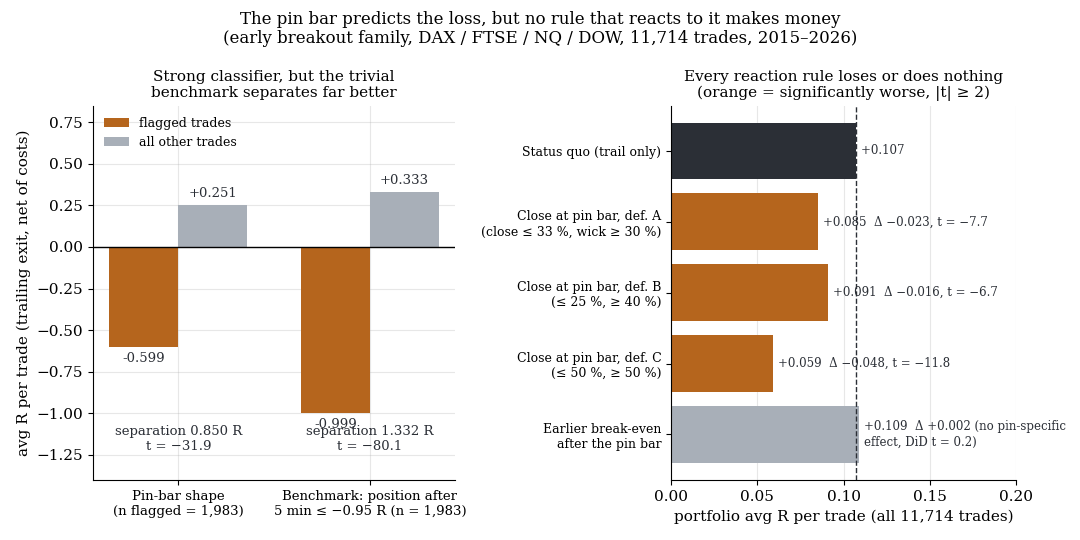
The pin bar separates −0.60 R from +0.25 R; the trivial benchmark "position after 5 minutes" separates better. Every rule that reacts to the pin bar loses or does nothing.
The benchmark every candle shape has to beat is the plain question: where does the trade stand after five minutes? Setting the threshold to produce the same group size (R after 5 minutes ≤ −0.95) separates far more sharply:
| Classifier | n flagged | avgR flagged | avgR rest | Separation | t |
|---|---|---|---|---|---|
| Pin-bar shape | 1,983 | −0.599 | +0.251 | −0.850 | −31.9 |
| Position after 5 min ≤ −0.95 | 1,983 | −0.999 | +0.333 | −1.332 | −80.1 |
And once you control for the position after five minutes, the wick's sign flips. Within narrow bands, a trade with a wick is better than one without:
| Position after 5 min | with wick | without wick | Δ | t |
|---|---|---|---|---|
| −0.75 to −0.50 | −0.675 | −0.843 | +0.168 | 3.7 |
| −0.50 to −0.25 | −0.339 | −0.696 | +0.357 | 6.6 |
| −0.25 to 0.00 | −0.072 | −0.489 | +0.416 | 7.3 |
| 0.00 to +0.25 | +0.355 | −0.229 | +0.585 | 8.8 |
| above +0.25 | +1.127 | +1.126 | +0.001 | 0.0 |
The mechanism: the wick in the break direction measures how far the trade was ahead at some point in the first five minutes. At the same position, a trade that has already shown movement is better than one that merely crept there. The pin bar looks bad because its close is low, not because its wick is long.
3. Closing immediately: harmful
At the close of the pin bar the trade stands at −0.733 R on average. Whoever exits there sells the low; the trail recovers to −0.599 R.
| Rule "exit immediately on pin bar" | Pin trades Δ | t | Portfolio | Δ | t |
|---|---|---|---|---|---|
| Definition A (close ≤ 33%, wick ≥ 30%) | −0.133 | −7.8 | +0.085 | −0.023 | −7.7 |
| Definition B (tighter: ≤ 25%, ≥ 40%) | −0.152 | −6.8 | +0.091 | −0.016 | −6.7 |
| Definition C (wider: ≤ 50%, ≥ 50%) | −0.254 | −12.1 | +0.059 | −0.048 | −11.8 |
Status quo is +0.107 R. All three definitions lose, and the extra cost of an earlier exit is not even modelled. It is the same lesson as in our exit logic study: the system lives off the right tail, and mechanical early exits cost.
4. Earlier break-even: no effect
The second idea, pulling the stop to entry sooner after a pin bar, needs a benchmark: does the rule help more on pin days than on non-pin days? Otherwise one only measures the general effect of "break-even earlier".
| Break-even from next 15-min candle | Δ | t |
|---|---|---|
| on pin trades | +0.010 | 2.1 |
| on non-pin trades | +0.009 | 4.0 |
| Difference of differences | +0.001 | 0.2 |
No pin-specific effect. Portfolio +0.109 instead of +0.107 R, a difference of +0.002 R.
On a finer 5-minute trail grid a small difference of differences of +0.031 R (t = 2.7) does appear. But on that grid the whole family sits at about 0.00 instead of +0.107 R and the pin group at −0.238 instead of −0.599 R. The grid difference is ten times larger than the effect; A/B comparisons are only valid within one grid. The first run would have said "closing helps" because it accidentally compared against the 5-minute trail.
The reverse rule that could follow from section 2 ("in the red and without a wick: out") loses as well: −0.011 R per trade (t = −5.6) on 20.1% of flagged trades.
5. What this means
- The pin bar is information, but not tradeable information. It says the trade is behind after five minutes. The trail already knows that, and it reacts better than any rule that sells the candle's close.
- Candle shapes must be benchmarked against the trade's position. A classifier with t = −32 looks impressive until the trivial benchmark delivers t = −80. Without that comparison the shape would have acquired a life of its own that it does not have.
- The wick itself is, if anything, a positive signal. At the same position, early movement in the break direction is a plus. Whether that yields anything for sizing or position building is an open hypothesis, not measured.
- The rejection family dies again. Reclaim, second break, anti-trade, fade variants and now the pin bar: every rule that mechanically translates weakness after entry into an exit has so far cost money.
6. Limits
- In-sample over the full data set, no walk-forward. The paired t-values (variant minus base on the same trades) are the robust test; the absolute levels carry the grid bias.
- Extra costs of early exits not modelled. Costs sit only in the entry; closing and break-even are therefore shown too favourably. That strengthens the no.
- One setup type only, first break per day only. Whether pin bars after other entries (midday breakouts, later candles) show the same proxy structure is not tested.
- Not tested: suppressing pyramiding on pin days (plausible but unmeasured), and early movement in the break direction as a stand-alone positive signal.
📄 Full study as PDF: 6 pages incl. all tables, figures and limits (in German).
Disclaimer: Historical statistics are no guarantee of future market behaviour. This study is not investment advice. Trading involves risk of loss up to total loss.