Note, 29 September 2026: Part of the R values in this study comes from our older backtest chain, which also books positive R on a random market without direction. Those values are too high; results that do not depend on the chain (price statistics, counts) are unaffected. Details: The random market as a ruler.
Re-run, 5 October 2026: The 25 combinations of breakout rule and market from our rulebook have been re-measured on the corrected chain and on real broker ticks. None has an advantage over the random market; after costs the mean is −0.08 R per trade. The affected R values in this study are therefore not proven, the other results are untouched. The volatility regime was tested as a filter for the breakout rules: across all combinations the difference is +0.068 R (t 2.7), about half of which also appears on the random market (+0.033 R, t 2.1). The only candidate was not confirmed in the holdout (+0.058 R, t 0.3). All numbers: Our own breakout rules, re-measured.
Data basis: index setups on DAX, FTSE, NQ, Dow, SPX, 2015 – June 2026, 171,180 trades (breakout family n = 147,138, fade family n = 24,042). Exit in section 1: hold to cash close, entry net of spread and slippage. Day-type analysis in section 2: 11,513 market days DAX/FTSE/NQ/Dow. Volatility proxy: mean daily range of the last 5 days (previous-day value, i.e. known before the open), rolling terciles against 250 days. No trading recommendation.
The observation that triggered this study was mundane: a whole week in which every day had less range than the day before, and in which every breakout attempt came back. The suspicion behind it is textbook — momentum strategies need movement, mean-reversion strategies need calm. But the textbook has no numbers for our setups, and it does not say whether the regime can be recognised in time.
We separated three questions. Does setup performance move with volatility? Can the regime be determined objectively before the open? And — the least comfortable — how much of it is tradeable once hindsight is honestly subtracted?
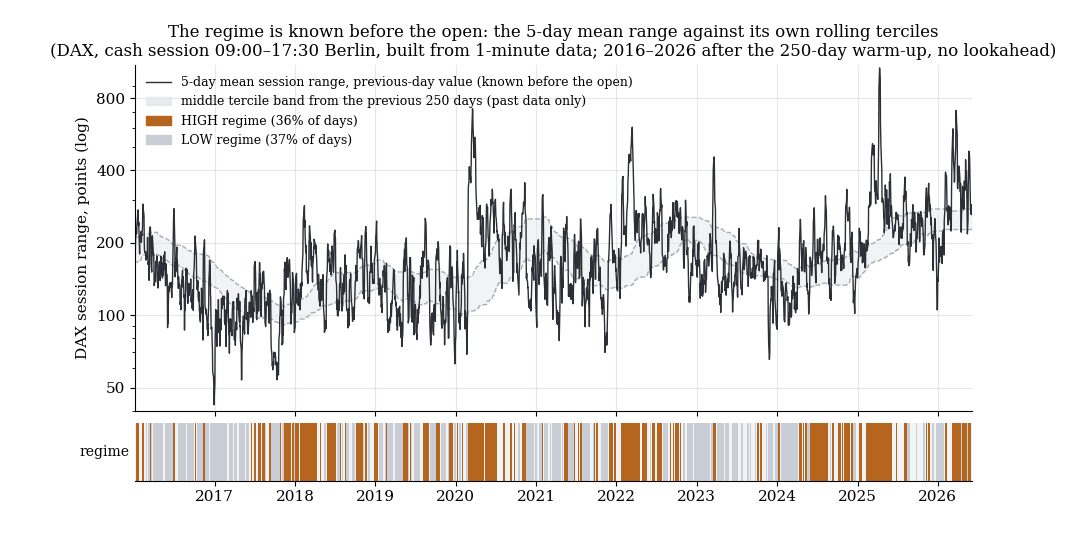
The regime is known before the open: the DAX 5-day range against its own rolling terciles from the previous 250 days. Orange = high regime, grey = low regime.
1. Performance by volatility regime
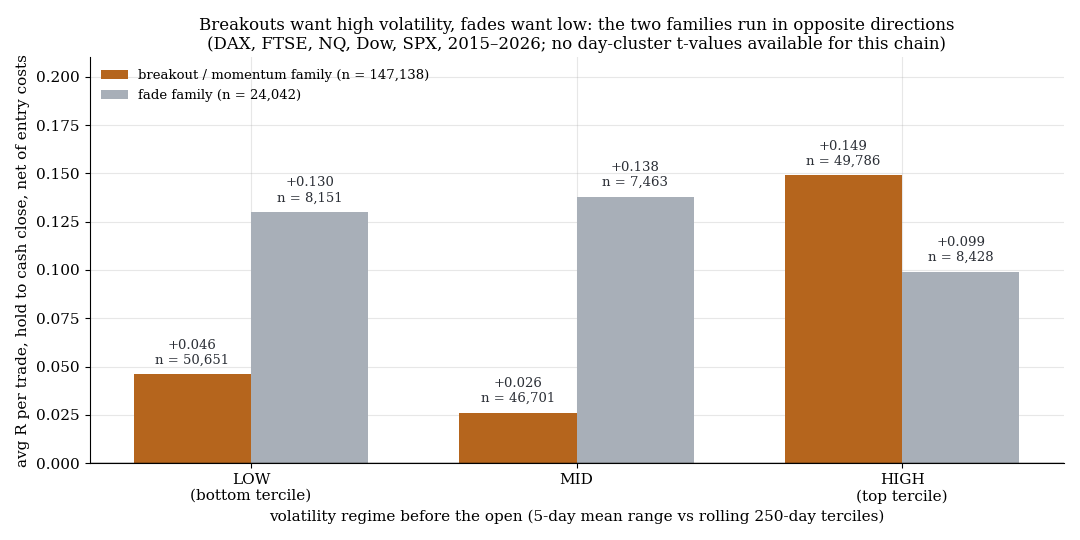
Breakouts want high volatility, fades want low: the two families run in opposite directions across the terciles.
Every market day gets a regime from the mean daily range of the last five days, compared with its own 250-day distribution: LOW (bottom tercile), MID, HIGH. The value is fixed the evening before. The regimes hold 34 / 32 / 34% of trades — almost evenly populated.
| Family | LOW | MID | HIGH |
|---|---|---|---|
| Breakout / momentum | +0.046 (n=50,651) | +0.026 (n=46,701) | +0.149 (n=49,786) |
| Fade | +0.130 (n=8,151) | +0.138 (n=7,463) | +0.099 (n=8,428) |
| All index setups | +0.057 (n=58,802) | +0.041 (n=54,164) | +0.142 (n=58,214) |
The breakout family triples its avgR from LOW to HIGH. The fade family runs the other way and does best in low and medium volatility. That is the expected picture, and with n > 7,000 per cell it is not noise — even though we have no day-clustered t-values for this chain (see limits).
DAX only, all setups: LOW +0.143 (n=12,775), MID +0.127, HIGH +0.165 (n=11,673). The effect is flatter in the DAX than in the pool — the DAX is the market where our setups run best anyway.
2. Is the regime recognisable before the open?
A regime you only know in the evening is useless. So we tested day types (trend, chop, whipsaw by our day-atlas classification) against three predictors that are all fixed the day before:
| Predictor (previous day) | Tercile 1 → tercile 3 | t |
|---|---|---|
| VIX level: P(trend day) | 10.0% → 14.1% | +5.6 |
| VIX level: P(chop) | 33.3% → 25.4% | −7.9 |
| ΔVIX (rose yesterday): P(chop) | 33.9% → 21.9% | −11.7 |
| ΔVIX: P(whipsaw) | +2.9 percentage points | +4.8 |
| Own ATR: P(trend day) | — | ≈ 0 |
Two things stand out. First: the VIX level works for the EU indices too — implied US volatility is a global proxy. Second: a VIX that rose yesterday is the strongest single predictor, and it does not announce trend days but decision days: less chop (−12 percentage points), but more trend and more whipsaw. That is a double-edged signal — more payday and more days on which the stop decides.
Our own ATR does not predict trend days. That is partly mechanical — our trend definition is ATR-relative, the normalisation eats the effect — but it does not change the consequence: the state (level) carries the information, the direction of the ATR does not. A separate test "ATR rising vs falling" gave Δ +0.03 R (t = 0.3).
For scale: even in the best regime, 86% of days are not trend days. This is a tilt, not a switch.
3. The VIX staircase
Absolute instead of terciles, computed on the real book series 2015–2026 (R per day across the whole book):
| VIX close, previous day | R/day | Trend-day rate |
|---|---|---|
| < 13 | +0.18 | 14.6% |
| 13 – 16 | +1.33 | — |
| 16 – 20 | +2.39 | — |
| 20 – 26 | +2.40 | — |
| > 26 | +3.01 | 24% |
The chop rate stays around 31% across all steps. Low volatility means missing paydays, not more disasters. And panic volatility is not a risk for a breakout book — it is the best environment.
4. What a filter actually delivers
Now the uncomfortable question. A gate "breakout family sits out the LOW tercile" cuts the maximum drawdown on the book series from −449 R to −259 R (from 2018: −136 to −77 R) and costs 17–19% of the return for it. That is an insurance trade, not a gain.
And the effect from section 1 is partly hindsight. Measuring the regime as realised (with the actual range of the day) instead of forecast (with the range of previous days) shows a much larger difference: realised-LOW sits at −0.25 R, forecast-LOW at +0.06 R. About one eighth of the hindsight effect is tradeable. The difference forecast-LOW vs the rest has t ≈ 1.3 and is positive in only 7 of 12 years.
5. What this means
The regime is real, known before the open, and cleanly explains why a range week is red for a breakout book. What it is not: an edge. The value lies in aggression control — reducing size when own range and VIX both sit in the bottom third, not in switching on and off. A gate that nearly halves the drawdown and costs a fifth of the return is a reasonable trade for an account with a hard drawdown limit; for an account without one it is forgone return.
This is the same finding as in our catalyst study: the conditions for good days are states, not dates. And as with every regime finding, what we measured in the edge persistence study applies — a structural effect should be stable across years. 7 of 12 positive years for the tradeable share is no such credential.
6. Limits
- Two different computation chains. Section 1 uses hold to cash close, not our trailing exit. On the trailing chain the fade finding reverses: there the morning fade setup runs best in HIGH volatility at +0.235 R. The fade part is exit-dependent and not conclusively resolved. The breakout part is consistent on both chains.
- No day-clustered t-values in section 1. Setups on the same day are coupled; the n figures overstate the effective sample.
- In-sample, no walk-forward split. The robustness check (7/12 years, t ≈ 1.3) is explicitly negative for the edge reading.
- Day-type thresholds are heuristic (atlas classification), VIX is US volatility and a proxy for the EU; no multiple-testing correction (3 predictors × 3 types).
- Gamma sign tested as an additional regime and rejected (n = 16,002, LONG vs SHORT t = 0.4). Not part of this study, but for completeness: it adds nothing beyond volatility.
- CFD data, index setups. FX and commodities were not tested here.
📄 Full study as PDF: 7 pages incl. all tables, figures and limits (in German).
Disclaimer: Historical statistics are no guarantee of future market behaviour. This study is not investment advice. Trading involves risk of loss up to total loss.