Note, 29 September 2026: The R values in this study come from our older backtest chain. On a random market without direction that chain still books positive R, so the absolute levels here are too high, and comparisons within the chain are not proven either. Why, and what we changed: The random market as a ruler.
Re-run, 5 October 2026: The 25 combinations of breakout rule and market from our rulebook have been re-measured on the corrected chain and on real broker ticks. None has an advantage over the random market; after costs the mean is −0.08 R per trade. Positive R levels and comparisons in this study are therefore not proven. For the book in this study this means: the total of +5,243 R is a result of the old chain. On the corrected chain the yearly mean of the 25 combinations configured most recently is negative in 10 of 12 years. All numbers: Our own breakout rules, re-measured.
Data basis: 66,511 trades, six breakout setups × DAX, FTSE, Dow, Nasdaq, 05 Jan 2015 – 05 Jun 2026, 2,949 trading days. Unselected book: every setup-market cell runs, including the known weak ones; no add-on positions, no skips, no risk overlay. Exit: trailing stop BE 0.5 / TS 1.0 / step 0.5 (two setups hold to session end), paths in 5-minute buckets, costs (spread + slippage) at entry. First break per setup and day. No trading recommendation.
The question was simple: how would the book have turned out over the last eleven years — every trade, equity, drawdown, and what that means in percent at real risk? Not the selected live version with filters and a risk overlay, but the raw book: six breakout setups, four indices, every cell armed.
The answer is one number people like to quote, and a second one they have to.
1. The total
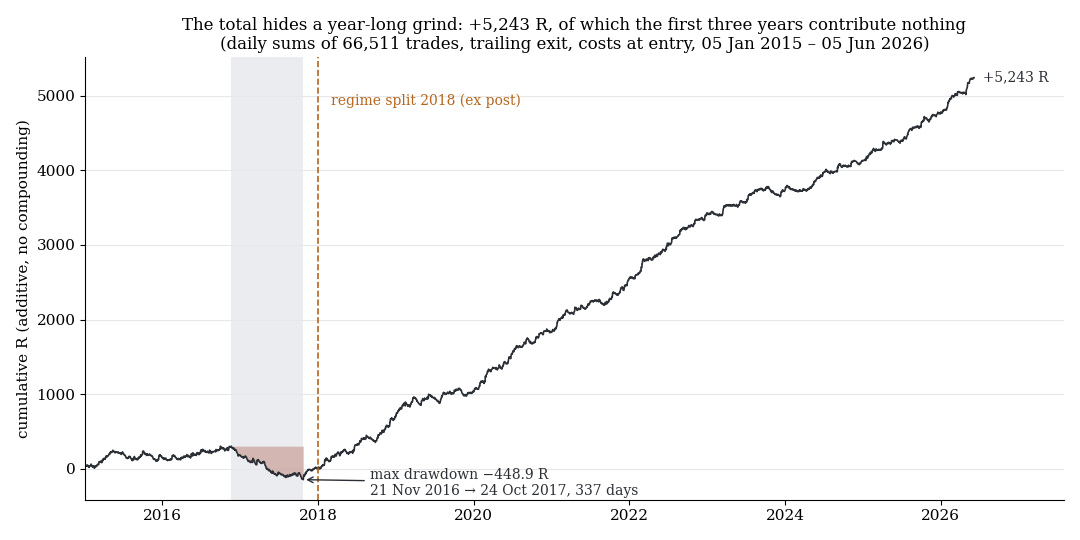
Cumulative daily R from 66,511 trades: the first three years contribute nothing, the −449 R drawdown is a 337-day grind, not a crash.
| Exit | Sum R | avgR | R per year | Win rate |
|---|---|---|---|---|
| Trailing (two setups hold) | +5,243 | +0.079 (t = +8.4) | +460 | 30.7% |
| Trailing pure | +5,432 | +0.082 | +476 | 36.6% |
| Exit on the 2nd counter-candle | +659 | +0.010 | +58 | 36.6% |
The third row is the reference from our study on the mechanical exit: the same set of trades, closed with a counter-candle rule, loses 87% of the result. The first row is the book this study is about.
+5,243 R in 11.4 years, day-clustered with t = +8.4. By market: DAX +2,500 R (avgR +0.150), Dow +1,352 R (+0.081), FTSE +942 R (+0.057), Nasdaq +449 R (+0.027). The book is positive, robust and spread across four indices. Anyone who stops reading here makes the mistake this study describes.
2. The daily series
| Metric | Value |
|---|---|
| Mean per day | +1.78 R (SD 11.54) |
| Share of green days | 46% |
| Best day | +76.0 R (25 Feb 2020) |
| Worst day | −17.4 R (10 Mar 2017) |
| Longest red streak | 10 days |
| Max drawdown | −448.9 R (trough 24 Oct 2017) |
| Negative months | 35 of 138 (25%) |
| Worst month | −102.4 R (May 2017) |
| 5th percentile of months | −55.8 R |
Two things stand out. Fewer than half the days are green — the book earns on a minority of days, with a mean that is about a sixth of the daily standard deviation. And the drawdown, at −449 R, is almost a full year's return. At +460 R per year that would be a recovery time of roughly a year, if you assume the average. You should not assume the average.
3. Two regimes
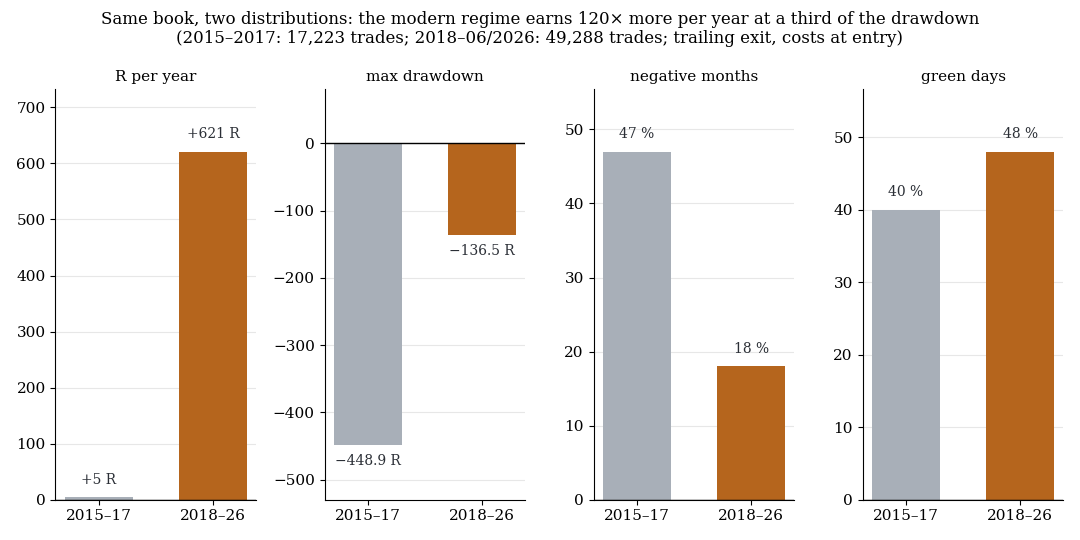
The same rule set, two distributions: the modern regime earns many times more per year at a third of the drawdown and fewer than half as many negative months.
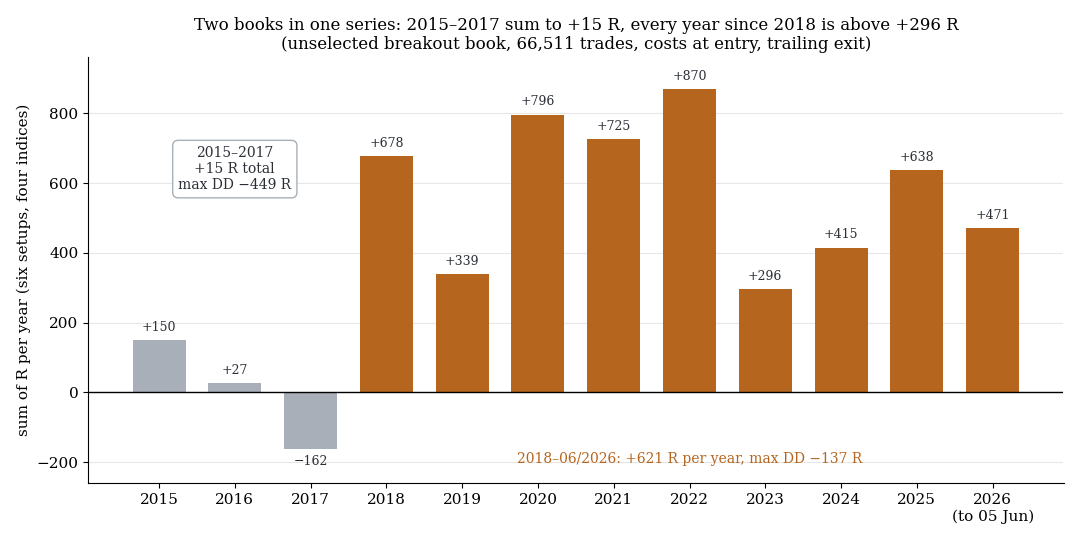
Two books in one series: 2015 to 2017 sum to +15 R, every year since 2018 is above +296 R.
The yearly slices show where the drawdown comes from:
| Year | Sum R | Year | Sum R |
|---|---|---|---|
| 2015 | +150 | 2021 | +725 |
| 2016 | +27 | 2022 | +870 |
| 2017 | −162 | 2023 | +296 |
| 2018 | +678 | 2024 | +415 |
| 2019 | +339 | 2025 | +638 |
| 2020 | +796 | 2026 (to 05 Jun) | +471 |
Roughly 5,800 trades per year. The first three years sum to +15 R — zero. From 2018 onward no year is below +296 R. Split the series there and you get two sets of books that have nothing to do with each other:
| 2015–2017 | 2018–Jun 2026 | |
|---|---|---|
| Trades | 17,223 | 49,288 |
| avgR | +0.001 (t = +0.1) | +0.106 (t = +9.5) |
| Sum R | +15 | +5,228 |
| R per year | +5 | +621 |
| Share of green days | 40% | 48% |
| Max drawdown | −448.9 R | −136.5 R |
| Negative months | 17 of 36 (47%) | 18 of 102 (18%) |
| Worst month | −102.4 R | −92.2 R (April 2019) |
| 5th percentile of months | −68.8 R | −36.8 R |
The −449 R drawdown is not a crash. It runs from 21 Nov 2016 to 24 Oct 2017, 337 days, with −126 R in 2016 and −323 R in 2017; the worst single day inside it is −17 R. That is a grind — a book trading for a year in a market that gives it nothing. Within the drawdown window, 54% of trades come from low-volatility days (base rate 35%), and those trades alone account for −316 R. It fits the finding that momentum needs high volatility: 2017 was a historic volatility low.
The regime is market-wide, not the quirk of one index. DAX avgR +0.081 → +0.174, Dow +0.037 → +0.097, FTSE +0.024 → +0.069, Nasdaq −0.135 → +0.084. All four markets switch together. The modern drawdowns — −136.5 R in 56 days (October to December 2023), −122 R and −111 R in 2019 — are a third of the old one and last weeks rather than a year.
4. What a volatility gate captures of this
If the dead regime hangs on low volatility, a gate suggests itself: pause momentum setups when the volatility tercile (known in advance, 250-day window) is low. In hindsight it works: max DD −449 → −259 R, from 2018 −136 → −77 R, worst month −92 → −42 R, at a cost of 17 to 19% of total return.
The robustness check puts that firmly into perspective. Only about an eighth of the hindsight effect is tradeable: trades on days with forecast low volatility return avgR +0.060 — positive — while trades on days with realised low volatility sit at −0.246. The second number is only known in the evening. The per-trade difference non-low minus low is just +0.024 (t ≈ 1.3), and non-low was better in only 7 of 12 years. Persistence is real but moderate: after a day forecast low, the probability of a low daily range is 44 to 47% against a 33% base rate; low phases last three days at the median.
The correct classification is therefore: a size dial, not a forecast. Half size in low phases lowers the drawdown by 30% for −9% of total return. That is insurance — Calmar up, expectation down — not an edge. Nor does chop announce itself: the autocorrelation of the daily series is −0.02, and the probability of a chop day after a chop day equals the base rate of 31%.
5. Sizing as a worked example
What does this mean in percent? The translation is additive (no compounding, no overlay), so it is rough.
| Risk per trade | Return/yr | Max DD | Worst month |
|---|---|---|---|
| Full period, 1.00% | +459% | −449% | −102% |
| Full period, 0.25% | +115% | −112% | −26% |
| Full period, 0.15% | +69% | −67% | −15% |
| Full period, 0.07% | +32% | −31% | −7% |
| From 2018, 0.25% | +155% | −34% | −23% |
| From 2018, 0.15% | +93% | −20% | −14% |
| From 2018, 0.07% | +44% | −10% | −7% |
Over the full period the raw book at 0.25% per trade is dead: a −112% drawdown is a closed account. Anyone with a drawdown budget of around 10% ends up at about 0.07% per trade with the raw book — and even that only in the modern era. The difference between the two regimes at equal risk is a factor of three in drawdown.
This is the point where selection and overlay are not cosmetics but the actual lever — see the sizing study. The raw book is the floor, not the expectation.
6. What a bad month is
A month of −45 R in this book is worse than 93% of all 138 months in the history — percentile 7. Ten of 138 months were that bad or worse — just under once a year over the full history; seven of the ten worst months lie in 2015 to 2017. In the modern distribution the same month is an event beyond the 5th percentile (−36.8 R). That is a genuine tail event, but a priced-in one, and no calendar pattern predicts it. July and October have the highest share of negative months at 45% each, yet a positive mean — with eleven observations per calendar month that is not robust. A fixed holiday month costs expectation; a regime gate does not.
7. What this means
The total is the wrong number. +5,243 R mixes three dead years with eight good ones and produces a drawdown no account survives. The relevant distribution is that of the regime you trade in — and at the same time you have to know the other regime exists.
The 2018 cut is ex post. It can be explained by volatility, but it was not chosen prospectively. Anyone taking the modern era as the baseline assumes that 2015 to 2017 will not return. That is an assumption, not a measurement. Sizing has to be chosen so that it is allowed to be wrong.
A bad month is percentile 7, not proof. Anyone who uses it as a reason to drop setups is reacting to variance. The number that checks this is the monthly distribution — and it already contains that month.
8. Limits
- Ex-post split. The regime boundary at 2018 is set in hindsight; the volatility explanation is plausible, but the starting year was not chosen prospectively. Gate figures are in-sample; the tercile convention was fixed in advance and is lookahead-free.
- Conventions of the episode basis. First break per day, path start at the open of the breaking bar (slightly pessimistic after V-sweeps), no add-on positions, no overlay, no skips. Trailing on M5 is more conservative than on M15.
- Additive percentage arithmetic. No compounding, no vol targeting, no daily limits. The sizing table is an order of magnitude, not a forecast.
- Unselected roster. Known weak setup-market cells are included; the book is deliberately the floor.
- Costs from configuration values per market, no slippage surcharges for stress days.
- Not tested: compounding paths, Monte Carlo of the daily series, the book with selection, a prospective regime classifier beyond the volatility tercile.
📄 Full study as PDF: 8 pages incl. all tables, figures and limits (in German).
Disclaimer: Historical statistics are no guarantee of future market behaviour. This study is not investment advice. Trading involves risk of loss up to total loss.