Note, 29 September 2026: Part of the R values in this study comes from our older backtest chain, which also books positive R on a random market without direction. Those values are too high; results that do not depend on the chain (price statistics, counts) are unaffected. Details: The random market as a ruler.
Re-run, 5 October 2026: The 25 combinations of breakout rule and market from our rulebook have been re-measured on the corrected chain and on real broker ticks. None has an advantage over the random market; after costs the mean is −0.08 R per trade. The affected R values in this study are therefore not proven, the other results are untouched. All numbers: Our own breakout rules, re-measured.
Data basis: DAX, FTSE, NQ, Dow, 2015 – 2026. Part 1: 56,308 episodes from our episode basis, exit trailing stop BE 0.5 / TS 1.0 / step 0.5, net of spread and slippage. Parts 2 and 3: 11,694 market days and 5,390 touch events on M1 data, pure price statistics with no costs. The bias is known before the open (cash open versus the pivot range of the prior days), so it is lookahead-free. No trading recommendation.
The Fisher/ACD bias is a simple number. If the cash open lies above the pivot range of the previous day, the day is +1; if it also lies above the 3-day and 7-day pivot ranges, it is +2. Mirror image for −1 and −2, and 0 in between. The indicator is public (TradingView, "Fisher ACD Addon"); its box colour shows the state.
The intuition behind it sounds compelling. If the bias reads +2, the market wants to take out the previous high. So on such a day one should only take longs and skip the shorts. We measured both — the day picture and the trade selection — and the answers diverge.
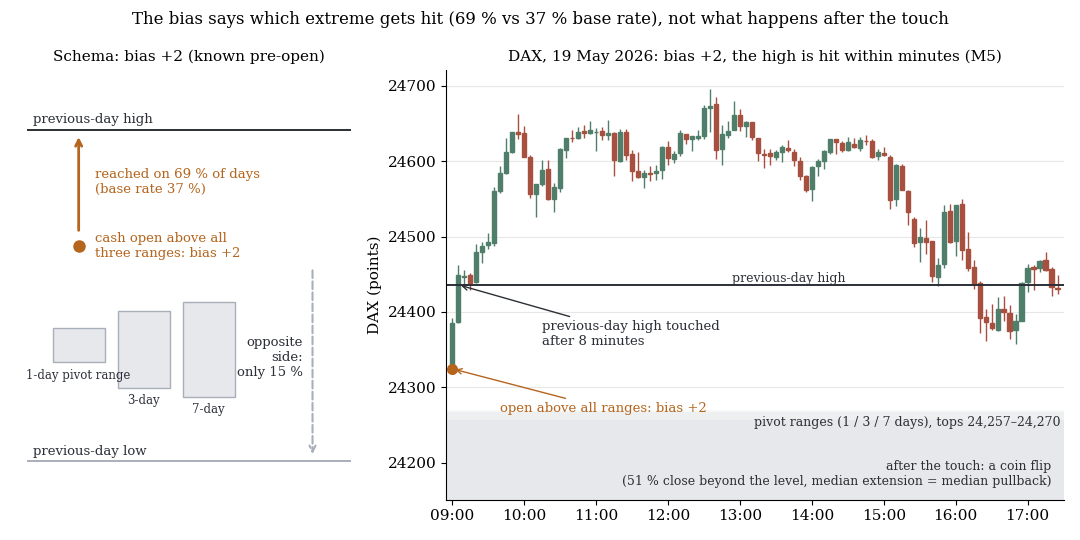
Left the schema: at bias +2 the previous-day high is touched on 69 % of days, base rate 37 %. Right a DAX day on which the high is reached after eight minutes and a coin flip follows.
1. The bias as a trade filter
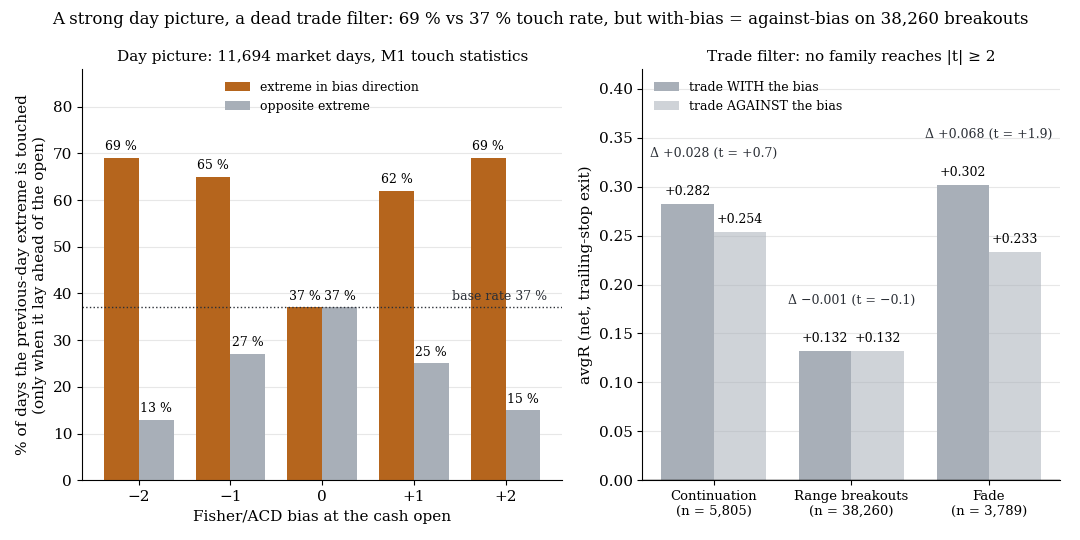
Strong day picture, dead trade filter: 69 % versus 37 % touch rate, but with-bias equals against-bias on 38,260 breakouts.
Each episode gets an alignment: bias times trade direction. +2 is full tailwind (a long on a +2 day), −2 full headwind. Three setup families measured separately: the continuation setups (reference-candle colour sets the direction), four range-breakout setups of the cash session, and one morning fade setup.
| Family | With bias | Against bias | Difference |
|---|---|---|---|
| Continuation | +0.282 (n=3,172) | +0.254 (n=2,633) | +0.028 (t = +0.7) |
| Range breakouts | +0.132 (n=19,213) | +0.132 (n=19,047) | −0.001 (t = −0.1) |
| Fade | +0.302 (n=2,315) | +0.233 (n=1,474) | +0.068 (t = +1.9) |
For the breakouts — by far the largest sample — the difference is exactly zero. The five alignment levels range between +0.125 and +0.143 R, and none deviates from the pool with |t| ≥ 0.8. Continuation and fade show the "right" direction, but below the |t| ≥ 2 significance threshold. For the fade, the full-headwind cell (−2, n=786, +0.210 R) is still clearly positive: a filter would have removed profitable trades.
As a selection rule the bias is dead. This is not a sample-size question — 38,260 breakout episodes are enough to detect even a 0.03 R effect.
2. The bias as a day picture
Second measurement, different question: does the cash session touch the previous high (PDH) or the previous low (PDL)? We only count cases where the target still lay ahead of the price at the open — otherwise the touch is a tautology (a +2 day often opens above the PDH already).
| Bias | PDH touched (if ahead) | PDL touched (if ahead) |
|---|---|---|
| −2 | 13% (n=2,277) | 69% (n=1,315) |
| −1 | 27% (n=1,928) | 65% (n=1,412) |
| 0 | 37% (n=1,730) | 37% (n=1,730) |
| +1 | 62% (n=1,161) | 25% (n=1,565) |
| +2 | 69% (n=2,402) | 15% (n=4,194) |
The base rate on neutral days is 37% for either side. At bias ±2 the extreme in the bias direction is reached 69% of the time, the opposite side only 13–15%. That is almost a doubling against the base rate and more than a halving on the other side — a real, large day picture known before the open.
For comparison, the colour bias we otherwise use for direction — the colour of the 10-minute reference candle before the open, here across all days:
| Reference candle | PDH touched | PDL touched |
|---|---|---|
| green (n=5,812) | 54% | 39% |
| red (n=5,871) | 49% | 45% |
The colour is significant (PDH green vs red +5 pp, t = +5.4; PDL red vs green +6 pp, t = +6.5) but small. The Fisher bias separates far more sharply at 69 versus 15%. For the question "which side gets visited today" it is the better instrument.
3. After the touch: the information is spent
If the bias predicts so well that the extreme is reached — does it also say what happens next? For every touch event (first touch of the extreme in the bias direction, target ahead at the open) we measured whether the session closes beyond the level, how far price extends past it, and how hard it pulls back.
| Bias | n | Close beyond | Median extension | Median pullback | Pullback first hour | Median touch time |
|---|---|---|---|---|---|---|
| ±2 | 2,500 | 51% | 0.35% | 0.36% | 0.19% | 13 min |
| ±1 | 1,632 | 50% | 0.35% | 0.37% | 0.20% | 21 min |
| 0 | 1,258 | 52% | 0.31% | 0.30% | 0.17% | 104 min |
Three rows, one picture: a coin flip. Continuation versus reversal is 50/50 in every bias state, extension and pullback are symmetric (0.35 vs 0.36%), and the first-hour stall is the same everywhere. The bias carries no information about reversal or continuation and works neither as a take-profit point nor as a reversal signal.
The last column explains why. On ±2 days the extreme is reached a median 13 minutes after the open — on neutral days only after 104 minutes. The information in the bias is consumed by the approach, and the approach is over almost immediately.
4. Why both findings fit together
How can a bias nail the day picture and be worthless for trade selection?
First, timing. The run to the extreme happens in the first minutes. The breakout setups trigger later and live off what comes after — and after the touch it is 50/50 regardless of bias.
Second, self-alignment. A range breakout breaks first on the side where the pressure is. On a +2 day the high of the reference range breaks before the low. The setups are therefore already aligned with the bias on their own; the filter adds nothing the break does not already know. Directional information that is already inside a setup is redundant as an external filter — the same pattern we found for the long-run drift in the long-bias study.
5. What this means
The Fisher bias belongs on the chart — as a day picture. It tells you which prior-day extreme is likely to be seen today (69 vs 15%), and it tells you before the open. That is context worth having.
It does not belong in the setup logic. Not as a selection rule (Δ = −0.001 R), not as a take-profit at the level (50/50 after the touch), not as a reversal trigger. Built in there, it filters noise and throws away trades that were exactly as profitable as the ones kept.
6. Limits
- In-sample, no OOS split. For a null result at n = 38,260 this matters less than for a finding — there is nothing to overfit.
- Continuation is partly redundant. The colour rule is itself a directional filter; an additional bias effect would be hard to isolate there anyway.
- Fade just below the threshold. t = +1.9 is not significance, but not a clean zero either. We treat it as "not robust", not as "refuted".
- Touch statistics without costs. Parts 2 and 3 count touches on M1 data, no spread, no slippage. They describe day structure, not trading results.
- The bias definition is our replication of the Pine logic on local calendar days; TradingView dailies may differ on individual days.
📄 Full study as PDF: 6 pages incl. all tables, figures and limits (in German).
Disclaimer: Historical statistics are no guarantee of future market behaviour. This study is not investment advice. Trading involves risk of loss up to total loss.