Note, 29 September 2026: Part of the R values in this study comes from our older backtest chain, which also books positive R on a random market without direction. Those values are too high; results that do not depend on the chain (price statistics, counts) are unaffected. Details: The random market as a ruler.
Re-run, 5 October 2026: The 25 combinations of breakout rule and market from our rulebook have been re-measured on the corrected chain and on real broker ticks. None has an advantage over the random market; after costs the mean is −0.08 R per trade. The affected R values in this study are therefore not proven, the other results are untouched. The filter described here was part of the re-run: across all matching combinations the difference is +0.108 R (t 1.7), on the random market +0.053 R (t 1.3). As a filter it is therefore not proven. All numbers: Our own breakout rules, re-measured.
Data basis: DAX and FTSE, 15 Apr 2015 – 05 Jun 2026, 2,851 and 2,824 usable days respectively (M1 data). Push = 08:59 close minus 08:00 open Berlin, normalised by the 20-day session range; strength as rolling terciles over 250 days, all from past data only. Part 1 is pure price structure, no costs. Part 2: all nine EU setups of our episode basis, 41,668 episodes, trailing stop BE 0.5 / TS 1.0 / step 0.5, net of spread and slippage. t-values over day clusters (DAX and FTSE on the same day are one draw). No trading recommendation.
The question came from live trading: when the EU indices have already run 50 or 80 points in one direction in the hour before the cash open — does follow-through come next, or does the market take the push back?
The follow-through camp says the push shows the direction of the day. The retracement camp says pre-cash trading is thin, and the cash open corrects it. We measured both — first as price structure, then as a filter on real setup trades. The answers differ, and that is the actual finding.
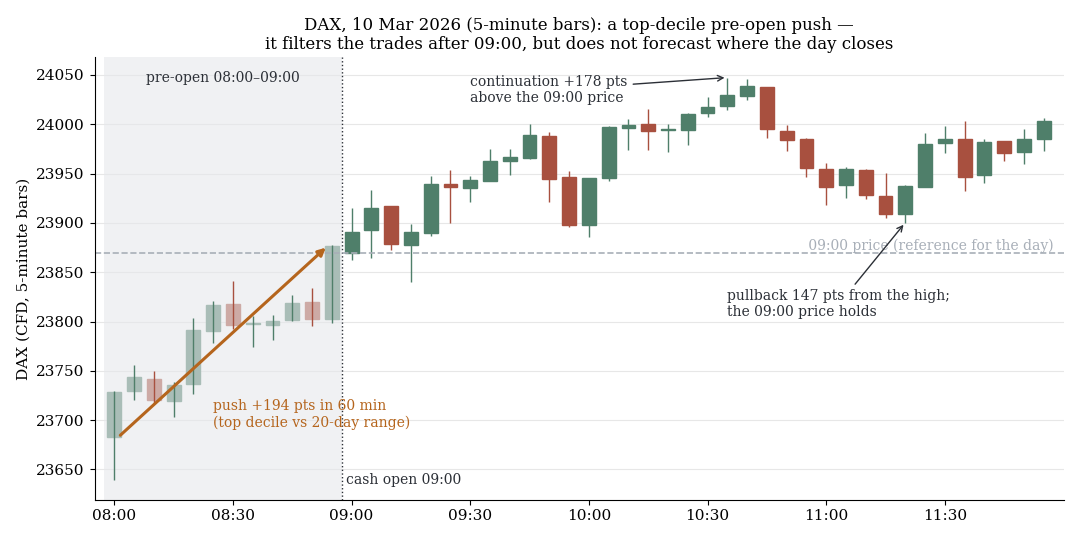
DAX, 5-minute candles: a top-decile pre-open push from 08:00 to 09:00, then continuation. The push filters the trades after 09:00 but does not forecast where the day closes.
1. As a direction forecast: neither
All values signed in the push direction and in units of the session range (ATR). Positive means follow-through, negative means retracement.
| Push strength | Market days | Continuation 09:00→10:00 | 09:00→11:00 | 09:00→close |
|---|---|---|---|---|
| LOW (quiet) | 1,900 | −0.000 (t = −0.1) | −0.000 (t = −0.0) | −0.003 (t = −0.2) |
| MID | 1,875 | +0.010 (t = +1.3) | +0.011 (t = +1.1) | −0.004 (t = −0.2) |
| HIGH | 1,900 | +0.015 (t = +1.7) | +0.023 (t = +2.1) | +0.026 (t = +1.4) |
| Top decile | 601 | +0.024 (t = +1.3) | +0.027 (t = +1.2) | +0.044 (t = +1.2) |
A single value reaches |t| ≥ 2: the two-hour drift in the HIGH bucket. In DAX points that is 4 to 5 points — at the cost threshold. With around 30 t-values computed, one to three hits are the random expectation. The top-decile bucket, which would have to be stronger if the effect were real, is not. CAC confirms the two-hour value (t = 2.7 without clustering), SMI does not (t = 1.1).
The mechanics behind it, HIGH bucket:
| Metric | Value |
|---|---|
| Max continuation in push direction (median) | 0.449 ATR |
| Max counter-move (median) | 0.425 ATR |
| Days retracing > 50% of the push | 82.4% |
| Days erasing the push completely | 68.7% |
| Race: +50% extension before −50% retracement | 54.1% / 45.7% |
| Close in push direction | 51.5% (LOW bucket: 50.1%) |
Continuation and counter-move are almost symmetric. Two thirds of days undo the push completely — retracement is the rule. But the rule says nothing about the direction afterwards: 51.5% closing in the push direction is a coin flip.
2. As a setup filter: a different finding
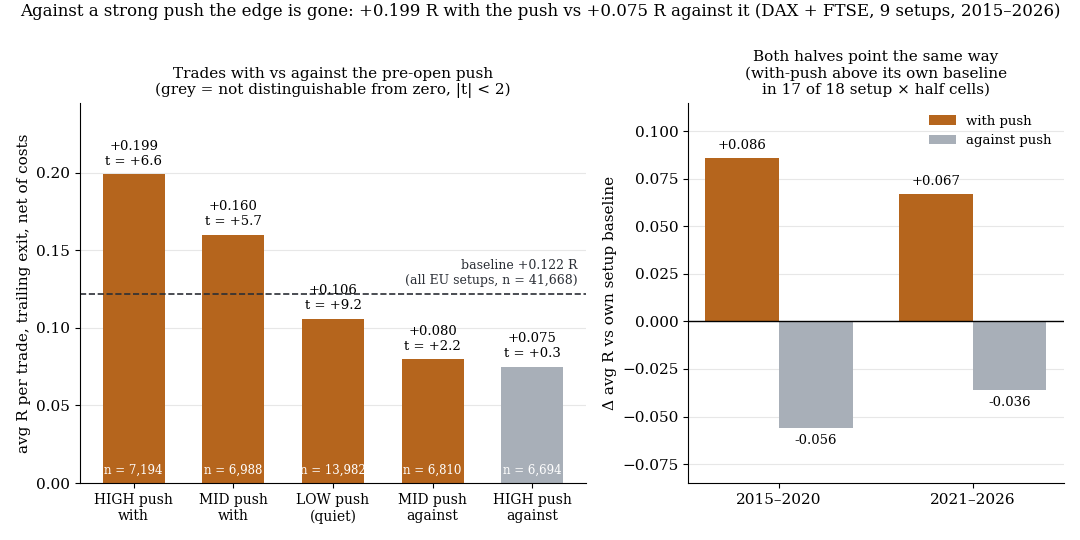
With the push +0.20 R, against a strong push +0.08 R and not distinguishable from zero. Both halves of the sample point the same way, 17 of 18 cells are consistent.
Now the same daily feature applied to real trades. Each episode gets two attributes: the push strength of the day, and whether the trade goes with or against the push direction. The push is complete at 09:00; all nine EU setups trigger later.
| Cell | n | avgR | t | Δ baseline |
|---|---|---|---|---|
| Baseline, all EU setups | 41,668 | +0.122 | +17.0 | — |
| Push HIGH & WITH | 7,194 | +0.199 | +6.6 | +0.077 |
| Push MID & WITH | 6,988 | +0.160 | +5.7 | +0.038 |
| Push LOW (quiet) | 13,982 | +0.106 | +9.2 | −0.016 |
| Push MID & AGAINST | 6,810 | +0.080 | +2.2 | −0.042 |
| Push HIGH & AGAINST | 6,694 | +0.075 | +0.3 | −0.046 |
A monotonic gradient from WITH to AGAINST, spread 0.124 R. The against cell is statistically indistinguishable from zero — no man's land after costs. And the WITH filter lifts all nine setups above their own baseline, from +0.028 (the reference-candle setup, which already carries a filter of its own) to +0.206 (a morning fade setup). Averaged across setups: WITH +0.087, AGAINST −0.054.
How does that square with part 1? A day can close in the push direction or not — that is the coin flip. But a setup trade does not live until the close; it lives in the hours after its trigger with a trailing stop. Whether the market runs cleanly in one direction during those hours is a different question from where it stands in the evening.
3. Three counter-checks
Nine of nine setups positive is too clean to believe unchecked. Conditioning on daily features has died three times in this workspace on the same mechanism: "the setups align themselves — the trend side breaks first."
C1 — Is the push just the last candle? The last ten minutes of the window (08:50–09:00) are the reference candle of one of our setups. The two segments are independent at corr = −0.025 and 48.4% direction agreement, and each works on its own: 10-minute candle WITH Δ +0.097 (t = +8.6), early hour 08:00–08:50 WITH Δ +0.048 (t = +5.0). Holding the candle direction constant, the early hour still carries — and exactly where it counts: when the candle is AGAINST the trade, a strong early hour WITH the trade lifts the cell from +0.047 to +0.121 (n = 3,523, t = +2.3). When the candle is already aligned, it adds almost nothing (Δ +0.024). The candle is the main carrier, the hour before it the safety anchor.
C2 — Do the setups align themselves? Long share on upward pushes 55.9%, on downward pushes 52.8%, overall 54.6%. The HIGH bucket splits 51.8 / 48.2% into WITH and AGAINST. The setups do not preferentially trigger in the push direction — AGAINST is not a different trade population but the same setup catalogue on the other side. The filter works both ways: long Δ +0.096 (t = +6.6), short Δ +0.052 (t = +2.7).
C3 — Does it hold in both halves? 2015–2020: WITH Δ +0.086 (t = +4.6), AGAINST Δ −0.056. 2021–2026: WITH Δ +0.067 (t = +4.7), AGAINST Δ −0.036. Per setup and half, WITH-push beats its own baseline in 17 of 18 cells; the sole exception is one morning breakout setup in the second half.
4. What this means
Two measurements, two answers, no contradiction. As a forecast of the day's direction, the pre-open push is worthless — it belongs in the same row as our finding that the first candle does not predict the rest of the day. As a condition for a setup trade it is the opposite: the difference between trades with and against a strong push is 0.124 R, consistent across setups, directions and halves of the sample.
The reading is not "buy the push". It is: on days with a strong pre-open push, the counter-direction has no measurable expectancy left. That is an exclusion criterion — the same structure we find in the catalyst study and in volatility: daily features are good for filtering out, not for confirming.
Two thirds of the effect sit in the 10-minute candle, which is partly already in our setup catalogue. The new contribution of this study is the hour before it — and its value lies exactly in the cases where candle and trade disagree.
5. Limits
- In-sample across the full period. The half split is pseudo-OOS, not walk-forward; the effect was found on the same data it was checked on.
- Daily feature, coupled cells. The push hits all setups of a day at once; the cell n figures overstate the effective sample. That is why only the clustered t-values count.
- Multiple testing. 9 setups × 6 cells; at |t| ≥ 2 individual hits are chance. We therefore rely on consistency across setups, not on single cells.
- Part 1 without costs, pure price structure. The pre-cash hour is thin trading with wider spreads.
- Not tested: other push windows, push as a size regulator instead of a yes/no filter, US indices, transfer to CAC/SMI as tradeable markets (there only as a price-structure cross-check).
- CFD data, ending June 2026. The setup family is ours; absolute levels are optimistic, relative comparisons robust.
📄 Full study as PDF: 6 pages incl. all tables, figures and limits (in German).
Disclaimer: Historical statistics are no guarantee of future market behaviour. This study is not investment advice. Trading involves risk of loss up to total loss.