Data basis: DAX and FTSE, M1 data, 2015–2026, 2,892 shared trading days (intraday test); DAX, FTSE, NQ, DOW, SPX, 2,912 shared trading days (daily test). Pure price statistics in percent, no costs modelled. Lookahead-free: the divergence is known at 10:30 Berlin, the return is measured afterwards. No trading recommendation.
The observation that prompted the question was concrete: the FTSE ran strongly in the morning while the DAX stayed put. That looks like a lag. Two indices from the same region, the same macro news, high correlation — if one runs ahead, the other should follow. The catch-up bet would be to buy the laggard.
The idea has a serious daily-basis variant too: one index decouples sharply from the group on a given day (all others clearly green, this one red). If divergence is an imbalance, the gap should close the next day.
We measured both. The answer is the same in both cases.
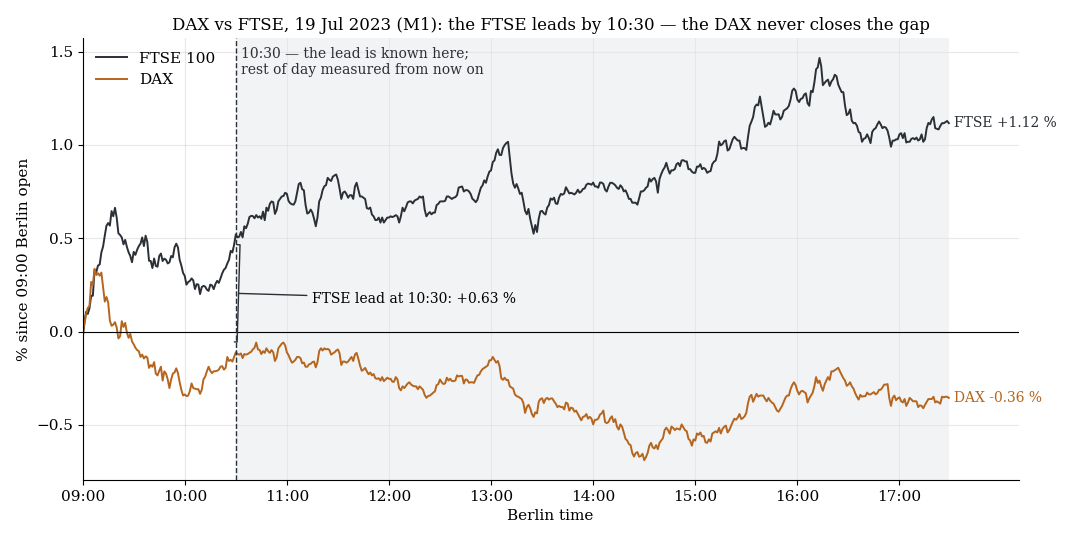
Both indices normalised from 09:00 Berlin: the FTSE leads by 0.63 % at 10:30, the DAX never closes the gap by 17:30.
1. The intraday test: DAX rest-of-day after a FTSE lead
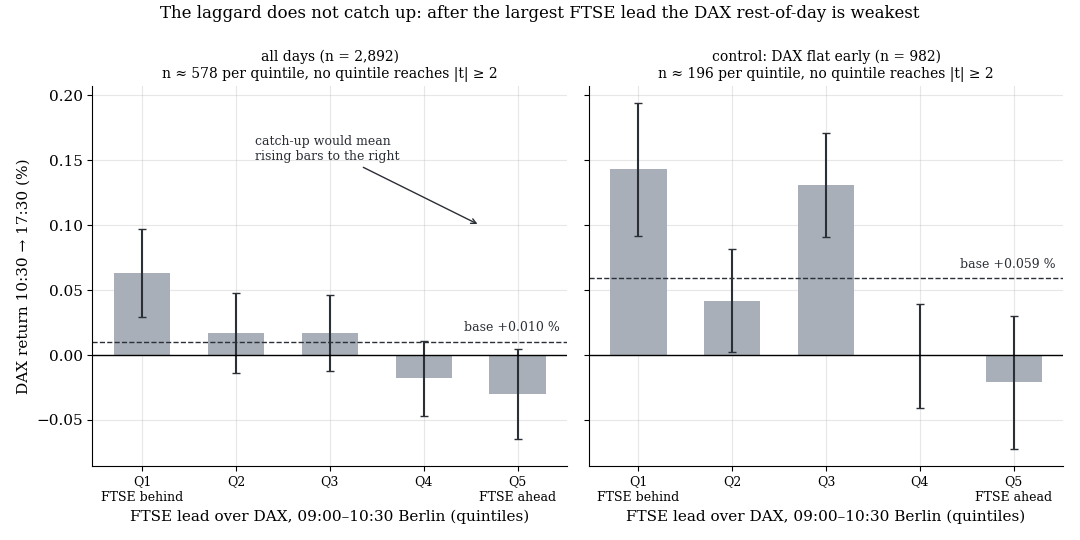
The laggard does not catch up: after the largest FTSE lead the DAX rest-of-day is weakest. No quintile reaches |t| ≥ 2, not even in the control with a flat early DAX.
We define divergence as the FTSE early return minus the DAX early return in the shared window 09:00–10:30 Berlin. We then measure the DAX return from 10:30 to 17:30, sorted into divergence quintiles. Catching up would mean: the larger the FTSE lead, the more positive the DAX rest-of-day. The two early returns are correlated at 0.73 — so the divergence is the smaller part of the move, but it is there.
| Quintile | FTSE lead (09:00–10:30) | DAX return 10:30→17:30 | n | t vs. mean |
|---|---|---|---|---|
| Q1 | −2.02 to −0.26% (FTSE behind) | +0.063% (±0.034) | 579 | +1.5 |
| Q2 | −0.26 to −0.07% | +0.017% (±0.031) | 578 | +0.2 |
| Q3 | −0.07 to +0.08% | +0.017% (±0.029) | 578 | +0.3 |
| Q4 | +0.08 to +0.26% | −0.018% (±0.029) | 578 | −0.9 |
| Q5 | +0.26 to +2.03% (FTSE ahead) | −0.030% (±0.035) | 579 | −1.1 |
| Base | all days | +0.010% | 2,892 | — |
The gradient runs monotonically from top to bottom — in the opposite direction to the hypothesis. After the largest FTSE lead, the DAX rest-of-day is the weakest; after the largest FTSE lag, it is the strongest. No quintile reaches |t| ≥ 2, so the pattern is not robust as a counter-bet either. But the catch-up bet simply has no support in the data.
2. The control: only days where the DAX was flat early
The first test has an objection: a large FTSE lead also arises when the DAX itself fell sharply early on. Then one is measuring the DAX's own momentum, not catching up. We therefore restrict to days where the DAX early return sat in the middle tercile — the DAX genuinely just stayed put while the FTSE ran.
| Quintile | FTSE lead | DAX return 10:30→17:30 | n | t vs. mean |
|---|---|---|---|---|
| Q1 | −1.05 to −0.17% | +0.143% (±0.051) | 197 | +1.7 |
| Q2 | −0.17 to −0.03% | +0.042% (±0.040) | 196 | −0.4 |
| Q3 | −0.03 to +0.08% | +0.131% (±0.040) | 196 | +1.8 |
| Q4 | +0.08 to +0.21% | −0.001% (±0.040) | 196 | −1.5 |
| Q5 | +0.21 to +1.39% (FTSE ahead) | −0.021% (±0.051) | 197 | −1.6 |
| Base | all flat DAX days | +0.059% | 982 | — |
Precisely the cell the hypothesis needs — DAX flat, FTSE clearly ahead — delivers −0.021% against a base of +0.059%. The laggard does not follow. If anything, it falls further behind.
3. The mirror: FTSE after a DAX lead
The same construction reversed — FTSE flat early, DAX ran ahead, measuring the FTSE rest-of-day.
| Quintile | DAX lead | FTSE return 10:30→17:30 | n | t vs. mean |
|---|---|---|---|---|
| Q1 | −1.23 to −0.19% | +0.008% (±0.041) | 197 | −0.3 |
| Q3 | −0.06 to +0.06% | +0.019% (±0.036) | 196 | −0.0 |
| Q5 | +0.24 to +1.28% (DAX ahead) | +0.060% (±0.041) | 197 | +1.0 |
| Base | all flat FTSE days | +0.019% | 982 | — |
Here the point estimate at least points the right way — at t = +1.0 and a difference of four hundredths of a percent. That is noise, not an effect. Q2 and Q4 (not shown) sit at +0.000% and +0.009%.
4. The daily test across five indices
The second variant of the idea lives on a daily basis. We define an index's spread as its session return (open→close) minus the mean of the other four. A divergence event occurs when the group makes at least +0.75% and the index trails by at least 1.0%. We measure the spread on the following day and cumulated over three days. Catching up would mean a positive follow-on spread.
| Index | Events | Next-day spread | 3-day spread |
|---|---|---|---|
| DAX | 78 | −0.01% | +0.05% |
| FTSE | 89 | +0.00% | −0.09% |
| NQ | 22 | +0.16% (t = +0.8) | +0.02% (t = +0.1) |
| DOW | 15 | +0.34% | +0.05% |
| SPX | 9 | +0.30% | +0.02% |
| Pooled | 213 | +0.05% (t = +0.6, 54% positive) | −0.01% (t = −0.1) |
The unconditional base for the next-day spread is +0.02%. The pooled catch-up effect is three hundredths of a percent above that, at t = +0.6. Over three days even that disappears. The individual US cells look tempting at +0.30% and +0.34% — at n = 9 and n = 15 they are not robust, and the 3-day value falls back to near zero in both. The stricter definition (group ≥ +1.0%, lag ≥ 1.5%) yields exactly two events for the NQ in eleven years.
5. Why the divergence is not a lag
The catch-up bet assumes two correlated indices share the same fair value and one of them "has not arrived yet". That is the wrong picture. FTSE and DAX are composed differently — commodity, energy and bank stocks carry heavy weight in one, industrials, autos and chemicals in the other. When an oil-price jump or a sterling move drives the FTSE in the morning, that is not information about the DAX that the DAX still has to price in. The divergence is justified by composition: it arises because different news hits different indices, not because one index is slower.
The 73% correlation of early returns confirms this rather than refuting it: the shared part of the move is already shared. What remains is by construction the idiosyncratic part — and that has no reason to converge.
That the intraday gradient even runs slightly inverse fits the same picture: a day on which the FTSE runs far ahead and the DAX does not follow is a day on which DAX-specific news flow is weak. That tends to continue into the afternoon rather than reverse.
6. What this means
Looking at the partner index gives no head start for direction selection in one's own market. Neither the intraday lag to the FTSE nor the daily divergence from the group of five says anything about the laggard's subsequent path beyond the base rate.
This is the second measurement in a series arriving at the same conclusion. The third — whether the colour of the partner index's reference candle strengthens one's own setup — is in the study on colour agreement across pairs. The combined lesson: every market trades its own candle. Cross-market conditioning has so far delivered neither a filter nor an amplifier in our data, in any form.
What the partner index does deliver is a mechanism for the gap: the overnight drift study shows that European indices price in US afternoon moves only in the next morning's gap. That is a transfer overnight, between sessions — not a catch-up within the session that one could trade.
7. Limits
- Two fixed windows. Divergence was measured at 10:30 Berlin, the forward return to 17:30. Other cut-off times were not tested; a catch-up effect that lives only in the first 30 minutes after 10:30 and fades afterwards would be invisible in the rest-of-day sum.
- Quintiles at n ≈ 580 and 197. The control group (DAX flat early) has just under 200 days per cell; effects below roughly 0.1% daily return cannot be resolved there.
- Daily test with small n. 213 pooled events across five indices, only 46 of them in the US indices. The US cells are not robust.
- No costs, no setup logic. Pure index return was measured. Even an effect of +0.06% would not survive spread and slippage at the trade level.
- Only one pair intraday. DAX/FTSE is the only jointly tradeable session pair in Europe; the US pair NQ/DOW was not tested for intraday catch-up, only on a daily basis.
- In-sample. There was no parameter to optimise, but the windows were chosen before the test and not validated on a held-out half.
📄 Full study as PDF: 7 pages incl. all tables, figures and limits (in German).
Disclaimer: Historical statistics are no guarantee of future market behaviour. This study is not investment advice. Trading involves risk of loss up to total loss.