Note, 29 September 2026: The R values in this study come from our older backtest chain. On a random market without direction that chain still books positive R, so the absolute levels here are too high, and comparisons within the chain are not proven either. Why, and what we changed: The random market as a ruler.
Re-run, 5 October 2026: The 25 combinations of breakout rule and market from our rulebook have been re-measured on the corrected chain and on real broker ticks. None has an advantage over the random market; after costs the mean is −0.08 R per trade. Positive R levels and comparisons in this study are therefore not proven. All numbers: Our own breakout rules, re-measured.
Data basis: Reference candle setup (pre-open candle, break after cash open) on DAX, FTSE, NQ, DOW, episode basis 2015–2026, 7,108 continuation episodes in the pair cells, 2,908 and 2,935 pair days. Exit: trailing stop BE 0.5 / TS 1.0 / step 0.5, net of spread and slippage. Lookahead-free: both reference candles are complete before the open of their session. No trading recommendation.
The reference candle setup lives on continuation logic: a green pre-open candle favours the long break, a red one the short break. This is documented in the DAX reference candle study and the index comparison, and it is stable in our episode basis: long on green +0.257 R, short on red +0.236 R.
The question that follows is obvious. If Nasdaq and Dow both show a green reference candle, is the long side stronger than when only one is green? Two indices in the same session saying the same thing — that sounds like confirmation. And a split — one green, one red — sounds like a warning. Likewise for DAX and FTSE in Europe.
We measured it. The confirmation premium does not exist.
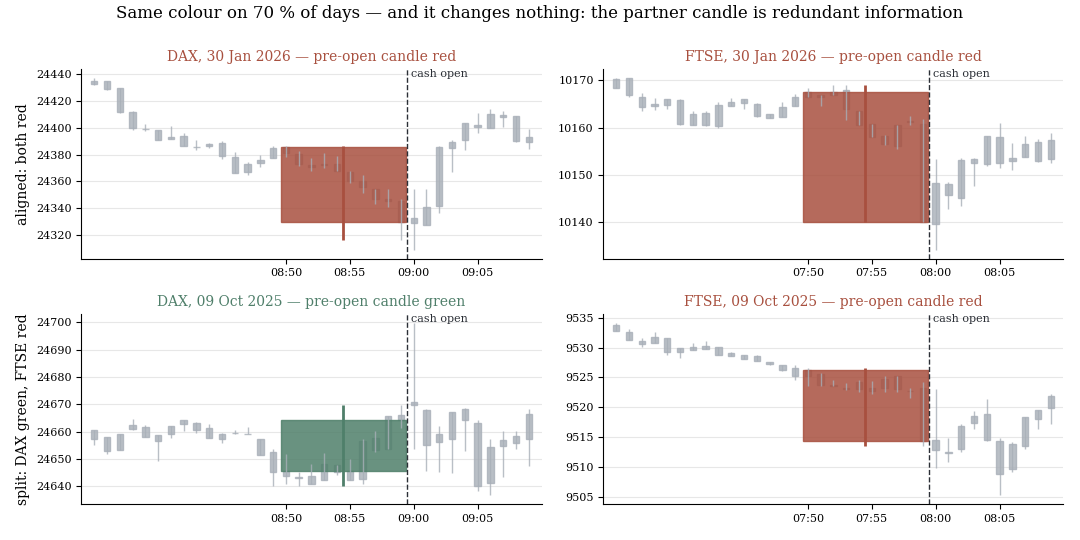
Two days, two pairs: on top DAX and FTSE show the same red pre-open candle, below they are split. On 70 % of days the colour agrees, and it changes nothing.
1. The anchor
Before any cell is split, the measurement has to reproduce the known figures. That guards against a computational error being sold as a finding.
| Cell (all markets pooled) | n | avgR |
|---|---|---|
| Long on green reference candle | 4,595 | +0.257 |
| Short on red reference candle | 4,343 | +0.236 |
| Long on red (counter-colour) | 2,938 | −0.189 |
| Short on green (counter-colour) | 2,768 | −0.224 |
The continuation cells are exactly the reference values. The counter-colour cells are clearly negative, as known — the colour of one's own candle is a strong filter. That is precisely what makes the partner candle question interesting: if one's own colour carries that much information, does the partner's carry more?
2. How often do the colours agree?
| Pair | Days | Same colour |
|---|---|---|
| NQ / DOW | 2,935 | 70% |
| DAX / FTSE | 2,908 | 70% |
On seven days out of ten, both indices of a pair have the same reference candle colour, identically in both regions. That is the first answer before a single trade is evaluated: the pre-open candle in both markets is coloured by the same overnight flow. What the partner shows, one's own candle usually already knows.
3. Continuation cells by partner colour
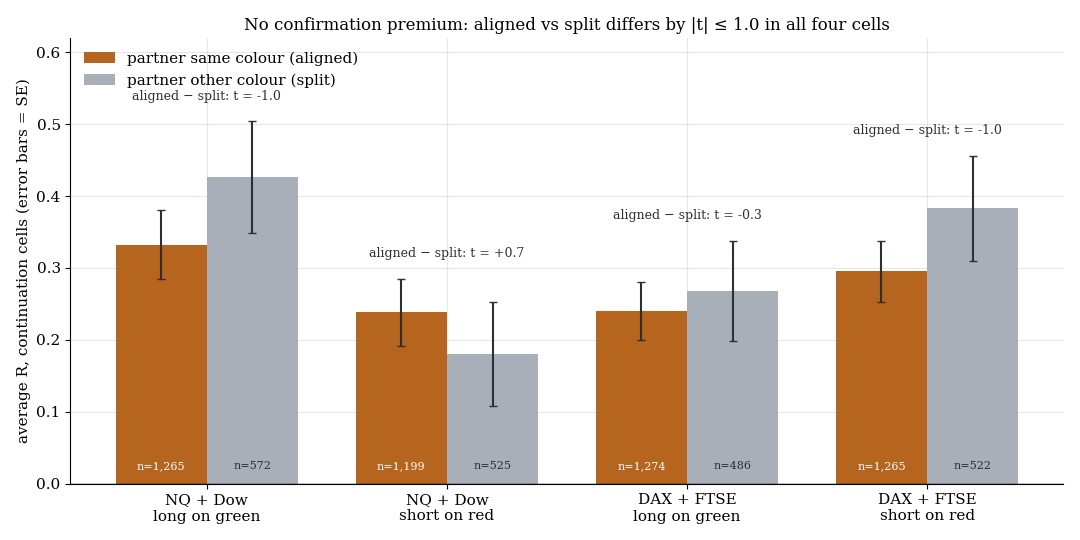
No confirmation premium: aligned versus split differs by |t| ≤ 1.0 in all four cells, three point estimates even lean towards split.
Each continuation cell per pair, split by whether the partner index showed the same colour that day (aligned) or the other one (split).
| Pair | Cell | Partner same | Partner different | Diff aligned−split |
|---|---|---|---|---|
| NQ+DOW | Long on green | +0.332 (n=1,265, SE 0.048) | +0.426 (n=572, SE 0.078) | −0.094 (t = −1.0) |
| NQ+DOW | Short on red | +0.238 (n=1,199, SE 0.047) | +0.180 (n=525, SE 0.072) | +0.057 (t = +0.7) |
| DAX+FTSE | Long on green | +0.240 (n=1,274, SE 0.040) | +0.268 (n=486, SE 0.070) | −0.027 (t = −0.3) |
| DAX+FTSE | Short on red | +0.295 (n=1,265, SE 0.043) | +0.383 (n=522, SE 0.073) | −0.088 (t = −1.0) |
None of the four differences reaches |t| ≥ 2. Three of the four point estimates even point the opposite way to the hypothesis: split days are nominally better than aligned days. That is not a counter-finding — at t = −1.0 it is noise — but it shows the confirmation premium is not visible even as a tendency.
The split cells have the smaller samples at n ≈ 500, with correspondingly wide standard errors around 0.07 R. An amplifier of the size the idea needs — say +0.1 R for aligned — would have shown up at these n as t ≈ 1.2 to 1.5. An effect on the scale of one's own candle colour (+0.45 R between continuation and counter-colour) would have been impossible to miss. Both are absent.
4. Cross-check: the counter-colour cells
If agreement does not help, does it at least hurt on the wrong side? A long on one's own red candle while the partner is also red should, by the idea's logic, run even worse than with a split partner.
| Cell (all four indices) | Partner same | Partner different | Diff |
|---|---|---|---|
| Long on red (counter-colour) | −0.185 (n=1,649, SE 0.034) | −0.076 (n=707, SE 0.065) | −0.109 (t = −1.5) |
| Short on green (counter-colour) | −0.168 (n=1,521, SE 0.038) | −0.250 (n=695, SE 0.053) | +0.083 (t = +1.3) |
The two cells contradict each other: in the long cell aligned is worse, in the short cell better. Both at |t| < 2. Anyone wanting to build a rule from the first row would have to ignore the second. That is the typical picture of a null effect that swings one way or the other at random in sub-samples.
5. Why the partner candle adds nothing
The 70% agreement is the explanation. The reference candle forms in the last minutes before the open, and what colours it is predominantly the overnight drift that hits both indices of a region simultaneously — US futures overnight, Asia, the European pre-market. That is the same mechanism that carries most of the index move in the overnight drift study.
When two candles are coloured by the same source, the second is not an independent observation. It confirms the first because it contains the same information, not because it supplies more. Confirmation from a redundant source is not confirmation.
The 30% split days are accordingly not the "warning days" but the days with a weak shared overnight signal, on which the index-specific component determined the colour. That these days run nominally slightly better would even be plausible in this picture — one's own candle then carries its own information — but at t ≈ 1 that is an interpretation, not a finding.
6. What this means
Looking at the partner index does not change the expectation of one's own setup. No amplifier on agreement, no warning on split, in none of the four continuation cells and in neither region. The setup logic remains what it was: every market trades its own candle.
This is the third failure of cross-market conditioning in our data. The DAX versus FTSE catch-up test showed that a partner running ahead intraday produces no follow-through; daily divergence across five indices does not close. Now pre-open colour agreement contributes nothing either. Three different questions, three different windows, the same answer: the partner index holds no information about one's own market that one's own market does not already show.
The methodological point is the anchor. With a badly built data join (wrong day, wrong candle), the aligned/split division would have produced inconspicuous but wrong numbers. That the pooled continuation cells reproduce exactly +0.257 and +0.236 before the split is the precondition for believing the null result.
7. Limits
- Split cells at n ≈ 490–570. Standard errors around 0.07 R. An amplifier below roughly +0.1 R could not be resolved — but an amplifier that size would hardly be worth the effort as a filter either.
- Two pairs, one setup family. We tested the reference candle setup. Whether partner colour contributes anything to other setup types (midday breakouts, fades) was not measured.
- Colour only. Size of the partner candle, extent of the partner's break, or whether the partner has already triggered were not tested as conditioning.
- In-sample, no epoch decomposition. An effect that exists only in one sub-period would be diluted in the pooled figure. At pooled |t| ≤ 1.0 it is unlikely, however, that a sub-period hides a stable amplifier.
- DOW special case. The DOW's known long asymmetry was not controlled for separately; we tested pure continuation logic in both directions.
📄 Full study as PDF: 7 pages incl. all tables, figures and limits (in German).
Disclaimer: Historical statistics are no guarantee of future market behaviour. This study is not investment advice. Trading involves risk of loss up to total loss.