Data basis: NQ, SPX, Dow, DAX, FTSE; M1 CFD data of the cash session in local time, 05 Jan 2015 – 05 Jun 2026, 2,832 to 2,916 sessions per market. Regression as in the paper: return of the last 30 minutes on the return of the first 30 minutes measured from the previous cash close, one observation per day, OLS. Variants: the same predictor without the gap (open to open + 30), and the rest of the day instead of the last 30 minutes as target. In sample 2015–2020, out of sample 2021–2026. Timing strategy: hold the target window in the direction of the predictor, net of spread plus slippage as basis points of price (median 1.4 to 2.4 bp). No trading recommendation.
"Market Intraday Momentum" (Gao, Han, Li, Zhou, Journal of Financial Economics 2018) is the academic reference for the idea that the open tells you something about the close. On SPY from 1993 to 2013 the return of the first half hour, measured from the previous close, predicts the return of the last half hour with a slope of 6.94 and an R² of 1.6%, significant at the 1% level. The paper ends in 2013 and reports no costs.
We ran the regression on our own data, on five indices, with the paper's definition and with one change that turned out to be the whole story.
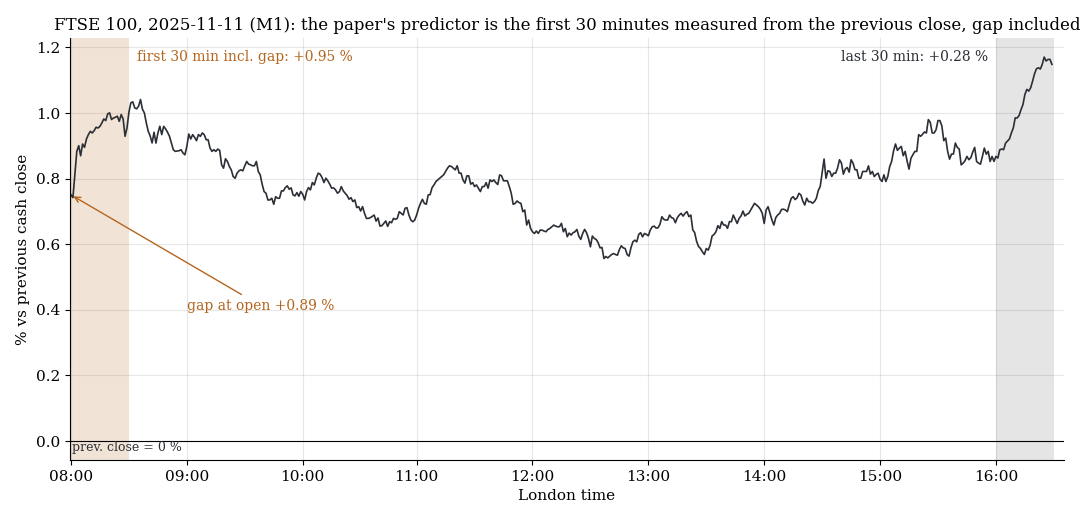
One FTSE session on minute data. The paper's predictor is the shaded first 30 minutes measured from the previous close: on this day +0.95%, of which +0.89% is the opening gap. The last 30 minutes, shaded grey, made +0.28%.
1. The paper's specification: three markets say no, two say yes
| Market | n | Slope | t | R² | Sign agreement |
|---|---|---|---|---|---|
| NQ | 2,834 | −0.003 | −0.4 | 0.01% | 50.4% |
| SPX | 2,834 | −0.013 | −1.7 | 0.11% | 49.0% |
| Dow | 2,832 | −0.008 | −1.1 | 0.04% | 47.8% |
| DAX | 2,916 | +0.021 | +4.2 | 0.60% | 52.6% |
| FTSE | 2,883 | +0.032 | +6.1 | 1.28% | 49.7% |
On the three US indices, the paper's own market family, the effect does not exist in 2015 to 2026. The slopes are zero or slightly negative, and the sign of the first half hour matches the sign of the last one on 48 to 50% of days. The paper's sample ended in 2013; whatever was there in the SPY data of the 1990s and 2000s is not in the index CFDs of the last eleven years.
DAX and FTSE are a different picture. The slopes are positive and significant, and the FTSE R² of 1.28% is close to the paper's 1.6%. Taken at face value this is a replication on two markets the paper did not study.
2. Remove the gap, and the slope goes to zero
The paper's predictor runs from the previous close to open + 30. That window contains two very different things: the overnight gap, which is known the moment the cash market opens, and the first 30 minutes of actual trading. We split them by measuring the same predictor from the open instead.
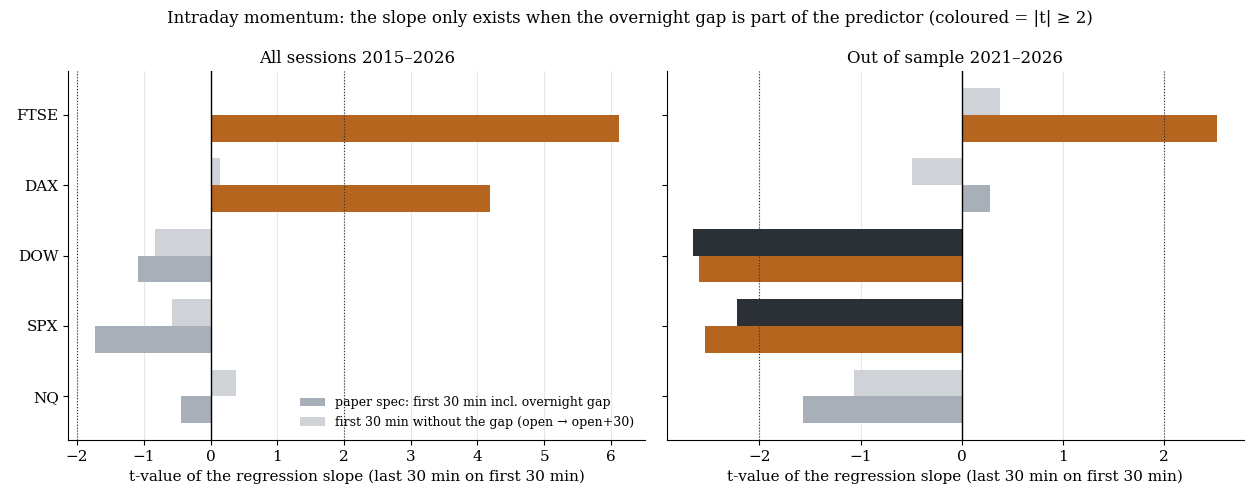
t-value of the regression slope per market. Orange or dark: |t| ≥ 2. Left all sessions, right out of sample.
| Market | Predictor incl. gap: slope (t) | Predictor without gap: slope (t) |
|---|---|---|
| NQ | −0.003 (−0.4) | +0.005 (+0.4) |
| SPX | −0.013 (−1.7) | −0.010 (−0.6) |
| Dow | −0.008 (−1.1) | −0.013 (−0.8) |
| DAX | +0.021 (+4.2) | +0.002 (+0.1) |
| FTSE | +0.032 (+6.1) | +0.000 (+0.0) |
Without the gap there is nothing left in any market. The DAX slope falls from t = 4.2 to t = 0.1, the FTSE slope from t = 6.1 to exactly zero. The first 30 minutes of trading carry no information about the last 30. The overnight gap does, in the two European indices, and only there.
That fits what we found in the overnight drift study: 75 to 85% of the DAX and FTSE movement happens overnight, because the US session runs on for hours after Europe closes. A large gap in Europe is a delayed reaction to information that arrived while the market was shut. That a piece of it persists into the last half hour is gap persistence, and the paper's "intraday momentum" on these markets is a relabelled version of it.
3. Out of sample, the gap effect shrinks
| Market | 2015–2020 slope (t), R² | 2021–2026 slope (t), R² |
|---|---|---|
| NQ | +0.010 (+1.0), 0.06% | −0.013 (−1.6), 0.18% |
| SPX | −0.001 (−0.1), 0.00% | −0.025 (−2.5), 0.47% |
| Dow | +0.004 (+0.4), 0.01% | −0.024 (−2.6), 0.50% |
| DAX | +0.034 (+4.5), 1.32% | +0.002 (+0.3), 0.01% |
| FTSE | +0.040 (+5.4), 1.86% | +0.018 (+2.5), 0.46% |
The DAX effect is entirely a 2015–2020 phenomenon; since 2021 it is gone. The FTSE keeps a third of its slope and a quarter of its R². The US indices move the other way out of sample: SPX and Dow show a negative slope at |t| = 2.5, which is a reversal, not momentum, and at R² of 0.5% not something to trade either.
The rest-of-day variant, first 30 minutes predicting open + 30 to close, adds nothing stable. NQ shows a positive slope on the gap-free predictor out of sample (t = 3.1) with nothing in sample (t = 0.3); the Dow shows a negative slope out of sample on the gap predictor (t = −3.5) with nothing in sample. Cells that appear in one half and not the other are what we file under fresh anomalies in the edge persistence study, and they get shrunk to zero.
4. The timing strategy loses money everywhere
The paper's trading application is simple: hold the last 30 minutes in the direction of the first 30. We charge spread plus slippage once per day, as basis points of price.
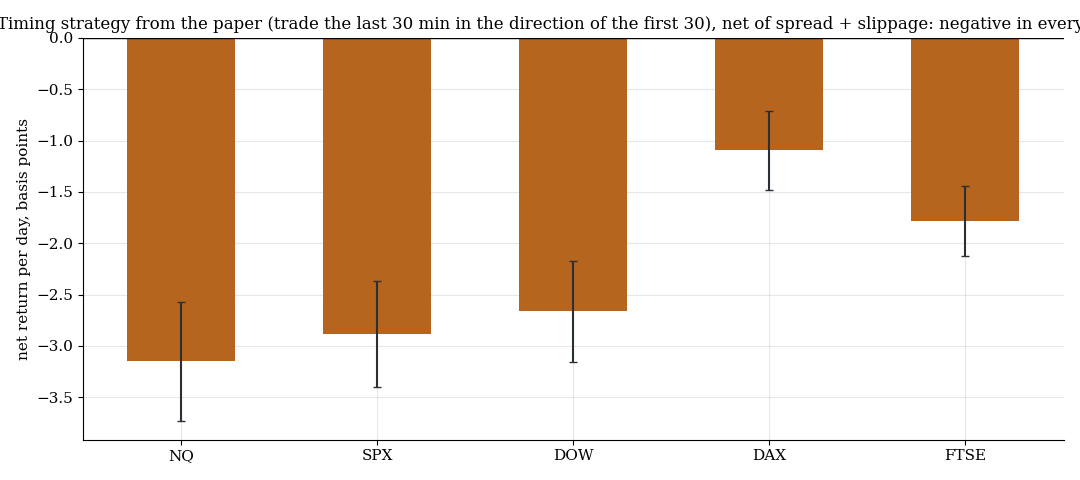
Net return per day of the timing strategy, paper specification, all sessions. Orange: |t| ≥ 2.
| Market | Net bp/day | t | Cost per day (median) |
|---|---|---|---|
| NQ | −3.15 | −5.5 | 2.3 bp |
| SPX | −2.88 | −5.6 | 2.4 bp |
| Dow | −2.66 | −5.4 | 1.4 bp |
| DAX | −1.10 | −2.8 | 1.9 bp |
| FTSE | −1.79 | −5.2 | 2.0 bp |
Even where the regression is significant, the strategy is not. An R² of 1.3% means the predictor explains 1.3% of the variance of the last half hour; the remaining 98.7% is noise that the spread is charged against every day. On the FTSE the gross edge is smaller than the 2 basis points a round trip costs, and the net result is −1.8 bp a day at t = −5.2. The out-of-sample cells and the gap-free predictor are negative as well, between −1.2 and −3.4 bp a day in every market.
5. What this means
The paper is right that the first half hour, measured from the previous close, predicts the last half hour on some markets. It is wrong to call that intraday momentum. On DAX and FTSE the entire effect sits in the overnight gap; strip the gap out and nothing remains, and the gap effect itself has been shrinking since 2021. On Nasdaq, S&P and Dow, the markets closest to the paper's SPY, the effect does not exist in 2015 to 2026 at all.
For trading the answer is simpler. A regression with an R² of 1% is a description of the market, not a signal. The timing strategy the paper implies loses 1 to 3 basis points a day net in all five markets, with t-values between −2.8 and −5.6. It is one of the cleanest negative results in our series: significant regression, significantly losing strategy, same data.
The method point is the one worth keeping. Any predictor that starts at the previous close carries the overnight return inside it. Before calling a result intraday anything, measure the same predictor from the open. If the effect disappears, it was the gap.
6. Limits
- CFD data, not SPY. The index CFD trades overnight, so "previous close" here is the cash-session close, as in the paper, but the CFD has no halt and the gap is a different object than an ETF gap. The gap-versus-no-gap split does not depend on this; the size of the gap effect might.
- The paper's period is not covered. 1993 to 2013 versus 2015 to 2026. This is not a test of whether the paper's numbers were right on its data; it is a test of whether the effect exists now, on these instruments.
- Costs of today on prices of 2015. Spread and slippage in points are current levels, converted to basis points of each day's price. For the early years that overstates costs slightly; the timing result does not hinge on it, the gross return of the strategy is already near zero.
- No volume, no VIX conditioning. The paper reports stronger effects on high-volume and high-volatility days. We tested the unconditional version only.
- 60 regression cells across markets, specifications and periods. At |t| ≥ 2 the random expectation is three; the two European gap cells hold in and out of sample and are the only ones we read as real.
Disclaimer: Historical statistics are no guarantee of future market behaviour. This study is not investment advice. Trading involves risk of loss up to total loss.