Data basis: Gold future (GC=F), daily closes from Yahoo Finance, 3 January 2005 to 29 September 2026. Five rules with the signal taken from the previous day's close: buy and hold, 200-day average (long only and long/short), Donchian 55/20 (long/short) and 12-month momentum (long/short). Costs 2 bps per position change (1 bp = 0.01%). Four market phases: 2005–2012, 2013–2018, 2019–2022, 2023–2026 (to September). Benchmark: buy and hold. No trading recommendation.
Gold rose from 1,631 USD at the end of 2022 to 5,318 USD on 29 January 2026 and recently stood at 4,180 USD. Many publicly shown gold strategies have looked very good since 2023, and the obvious reading is that the rule recognises the trend.
We test the opposite thesis. In a bull market a trend rule is almost always long, and then its curve mostly measures the gold price, so-called long beta. The test is simple: run the same rules through several market phases and compare them with buy and hold.
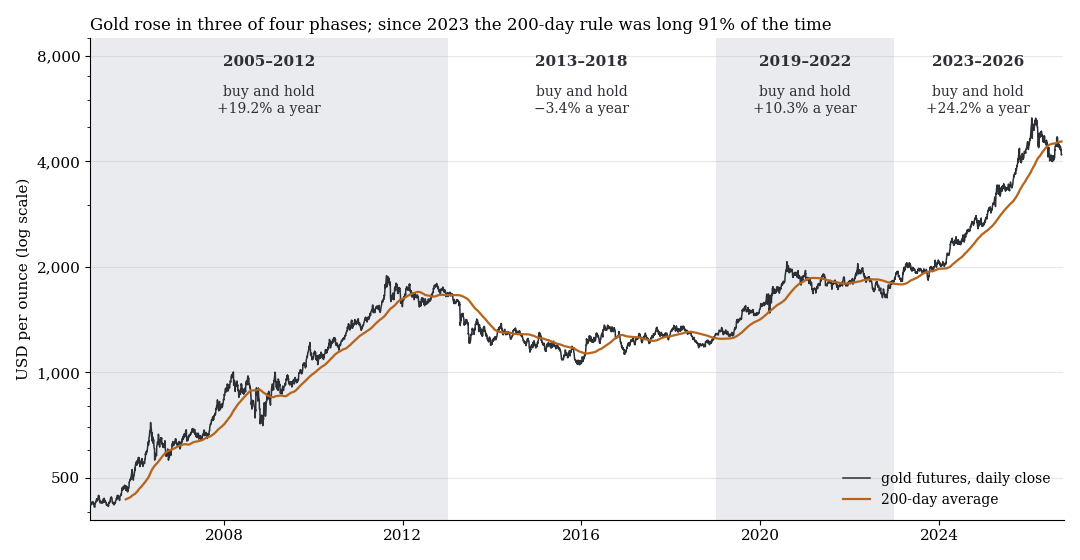
Gold future, daily close, logarithmic scale. Shaded: the four market phases with the yearly return of buy and hold, orange: the 200-day average. The phase boundaries follow the known price history and are not determined statistically.
1. In no rising phase does a rule beat buy and hold
Donchian 55/20: long at a new 55-day high, exit at a 20-day low, mirrored for short. Momentum: long if the return of the last 252 trading days is positive, otherwise short. 200-day average: long above the mean of the last 200 closes, otherwise flat (long only) or short (long/short). Return per year: 252 times the mean daily return after costs.
| Return in % per year | 2005–2012 | 2013–2018 | 2019–2022 | 2023–2026 |
|---|---|---|---|---|
| Buy and hold | +19.2 | −3.4 | +10.3 | +24.2 |
| 200-day average, long only | +13.6 | −2.8 | +2.4 | +23.7 |
| 200-day average, long/short | +9.0 | −2.3 | −5.5 | +23.1 |
| Donchian 55/20, long/short | +1.0 | −2.6 | −3.2 | +10.3 |
| 12-month momentum, long/short | +1.7 | −1.4 | −0.9 | +20.0 |
Buy and hold leads in three of four phases, in 2023–2026 with 24.2 against at most 23.7% a year. Since 2023 the 200-day average was long 91% of the time, the 12-month momentum 98%, Donchian 55%. In this phase the average and the momentum rule are hardly more than buy and hold with short breaks. In the weak 2013–2018 phase all five variants lose, the rules with −1.4 to −2.8% a little less than buy and hold with −3.4%. From 2013 to 2022 the rules are flat or negative.
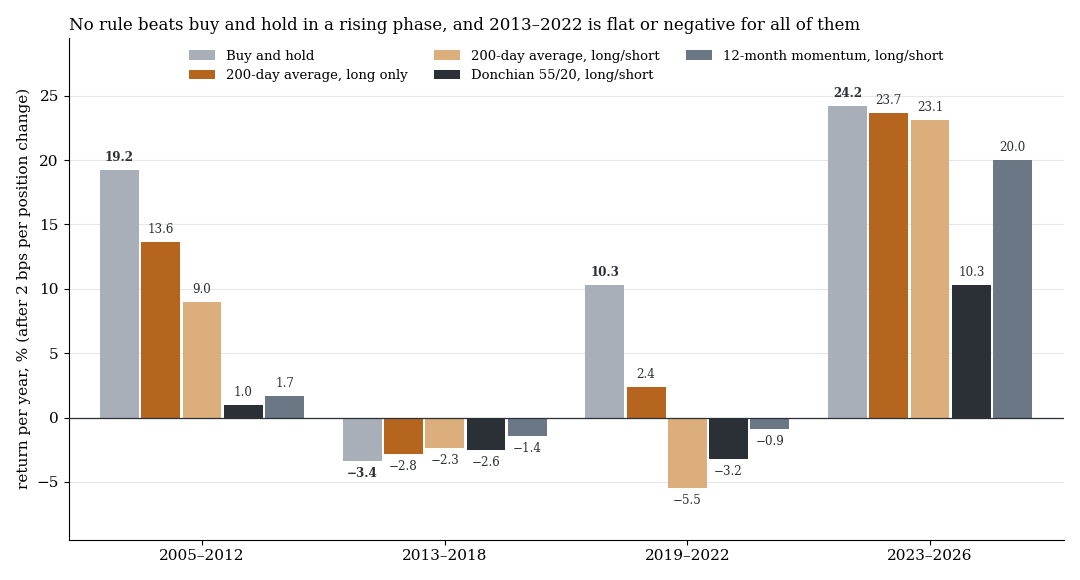
Return per year after costs by rule and market phase (grey: buy and hold). In the three rising phases buy and hold is the highest bar.
2. The profits come from the long side
The three long/short rules also go short. That cost money: the short side lost in 9 of 12 cells of rule and phase, −37 to −59 percentage points in 2005–2012 and −2 to −16 in 2023–2026, when the long days contributed +55 to +88. It was positive only in 2013–2018 (+0.1 to +6.2).
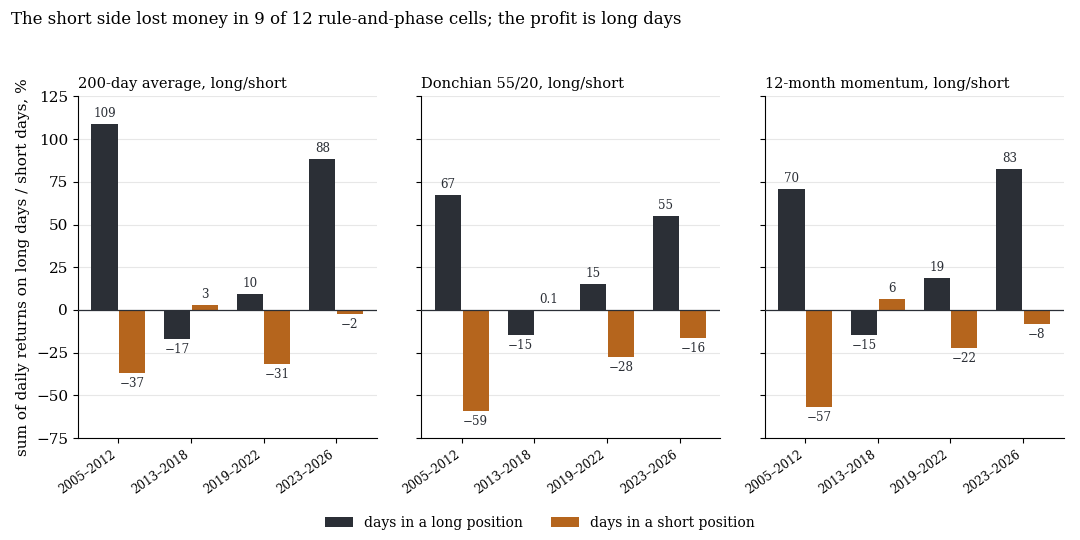
Sum of daily net returns on long days (dark) and short days (orange) in percentage points, not annualised. The phases are 8, 6, 4 and almost 4 years long.
What it means
The return of gold trend followers since 2023 is mostly the return of gold. A rule that makes over 20% a year in 2023–2026 and nothing in 2013–2022 has shown long beta here, not an advantage. One fair note on risk: the 200-day average (long only) had a smaller drawdown than buy and hold in three of four phases (2023–2026: −19.4 against −24.9%, Sharpe ratio 1.25 against 1.20). That is risk reduction through time out of the market, not a return advantage. For any publicly shown gold strategy, ask for the share of time in the market, the comparison with buy and hold in the same phase, and a curve that includes 2013 to 2022.
Limits
- Data source. Gold future as a continuous series with roll jumps, no spot and no CFD. Intraday stops, leverage and CFD financing costs (swap, the daily fee for held positions) are missing, and costs are a flat 2 bps per position change (long to short counts double).
- No significance tests. The evaluation has returns, Sharpe ratios and drawdowns per phase, but no standard errors, random market or holdout. Each phase is only 4 to 8 years, one draw.
- Not tested: other parameters (such as 100 or 150 days), volatility scaling, stops, other commodities. The study shows only that these four standard rules deliver no more than buy and hold in rising phases.
All pattern families of the scan in the overview. Related: reference candles on FX and gold, seven published anomalies net of costs, building a trading strategy with AI: the mistakes in the code.
📄 Full study as PDF: 6 pages incl. all tables, figures and limits (in German).
Disclaimer: Historical statistics are no guarantee of future market behaviour. This study is not investment advice. Trading carries a risk of loss up to total loss.