Data basis: SPY, QQQ and DIA (as proxies for the S&P 500, Nasdaq-100 and Dow; “US” is the daily mean of the three) and the DAX performance index (dividends included, from 1994), daily data from Yahoo Finance with raw prices and dividends. Search period 2000–2018 with a descriptive lead-in of SPY 1993–1999, separate holdout 1 January 2019 to 2 October 2026, one run. Costs: 2 bps spread and slippage per round trip (buy and sell), overnight financing by the Pepperstone formula, 70% of US dividends credited. Benchmarks: buy and hold as a CFD, forward CFD, futures as a side calculation. No trading recommendation.
A widespread claim, described in the literature (Cliff, Cooper and Gulen 2008; Lou, Polk and Skouras 2019), says that equity returns arise mostly overnight: from close to open indices rise, from open to close they barely do. The obvious plan follows: be long only overnight. That the upward drift of indices mostly arises overnight is also shown by our study on the overnight drift. Here we ask what is left after costs: a CFD account pays spread and swap, the overnight financing, every night.
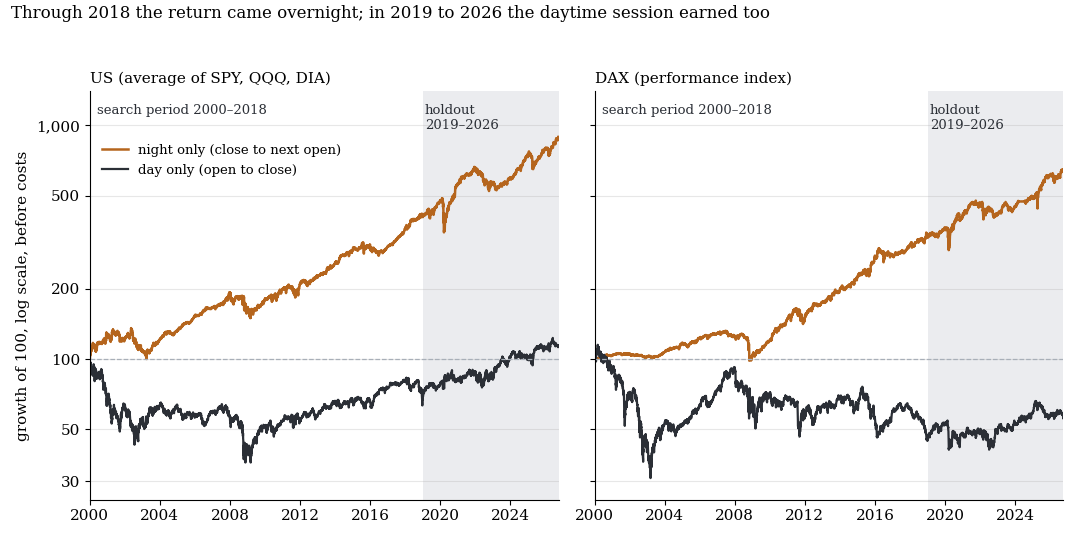
Growth of 100 when holding daily only overnight (close to next open, dividends included on the ex-date) and only by day (open to close), before costs, logarithmic scale. Left the daily mean of SPY, QQQ and DIA, right the DAX performance index. Shaded grey is the holdout from 2019: the day catches up, the night keeps running.
1. The Return Arises Overnight, Until 2018
| bps per trading day | Night | Day | Night minus day |
|---|---|---|---|
| US 2000–2018 (4,778 days) | +3.22 (t 4.13), 8.1% p.a. | −0.23 (t −0.17), −0.6% p.a. | +3.46 (t 2.14) |
| US holdout 2019–2026 (1,949) | +4.25 (t 2.32), 10.7% p.a. | +3.07 (t 1.81), 7.7% p.a. | +1.17 (t 0.47) |
| DAX 2000–2018 (4,822) | +2.67 (t 4.02), 6.7% p.a. | −0.75 (t −0.40) | +3.43 (t 1.72) |
| DAX holdout 2019–2026 (1,972) | +3.65 (t 2.17) | +1.51 (t 0.75) | +2.14 (t 0.88) |
| SPY 1993–1999 (1,748 days, lead-in, descriptive) | +8.00 (t 7.51) | +0.17 (t 0.09) | n/a |
Until 2018 the US market earned its entire return overnight, and the day brought nothing. In the holdout the day is no longer empty, and the gap shrinks to t 0.5. Is it a paid risk premium or an anomaly? We had expected a risk premium. The diagnostics fixed in advance speak rather against it: the night return is similar at low, medium and high VIX (US, search phase: +2.55 / +3.63 / +3.79 bps) and does not grow with the VIX (slope t −0.19). At the same time the loss tail is fat: the worst night was −807 bps (US, search phase) and −1,031 bps (holdout), kurtosis 11.6 and 25.2. Premium and anomaly cannot be cleanly separated with return data.
2. With CFDs Each Night Nets Zero
Whoever harvests the night with a CFD buys at the close every day and sells at the open. That costs 2 bps of spread and slippage (today's average Pepperstone spread corresponds to 0.4 to 0.6 bps, the rest is slippage) and the swap by the formula (reference rate + 2.5%) / 360 per calendar night, triple on Fridays (sources: Costs & Charges 02/2025 and 07/2025, index fees page 08/2026). On average that is 1.5 to 2.1 bps of swap per night held.
| bps per night held (t) | US 2000–2018 | US 2019–2026 | DAX 2000–2018 | DAX 2019–2026 |
|---|---|---|---|---|
| Night gross | +3.22 | +4.25 | +2.67 | +3.65 |
| Swap per night | −1.71 | −2.12 | −1.63 | −1.46 |
| Long every night, cash CFD net | −0.68 (−0.88) | −0.03 (−0.02) | −0.96 (−1.43) | +0.19 (0.11) |
| Only nights after high VIX, net | −0.31 (−0.17) | −0.14 (−0.03) | −0.71 (−0.42) | +3.70 (0.82) |
| Spread 1 bp instead of 2 | +0.32 | +0.97 | +0.04 | +1.19 |
| Forward CFD (3 bps round trip) | −0.49 | +0.13 | −0.96 | +0.18 |
| Futures (1 bp, no surcharge, side calculation) | +1.51 | +2.13 | +1.04 | +2.18 |
| Buy and hold as a cash CFD, per day | +1.08 (0.68) | +5.07 (2.05) | +0.33 (0.16) | +3.69 (1.32) |
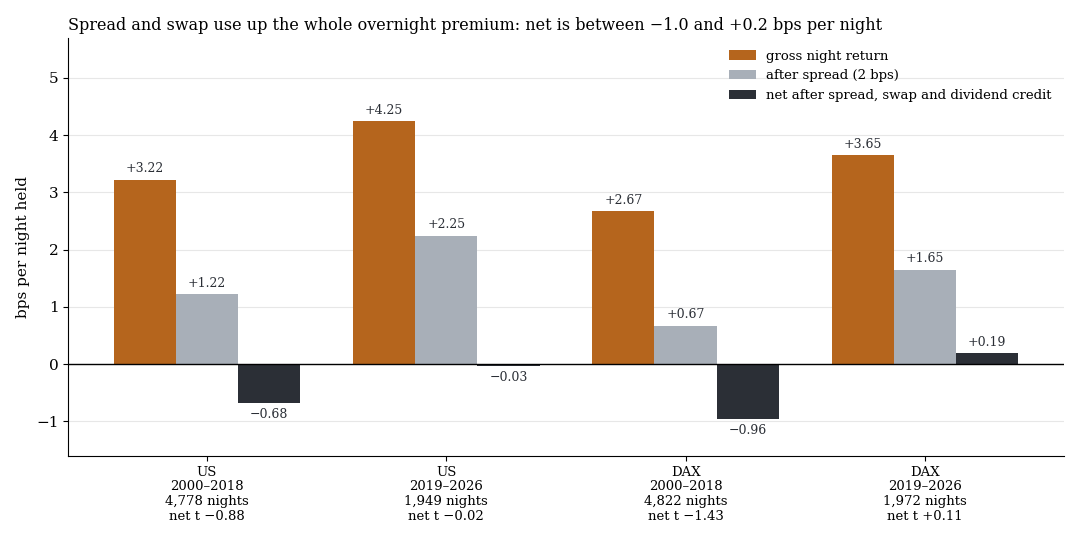
Basis points per night held. Second bar: gross minus 2 bps of spread. Third bar: net by the cost model, for the US ETFs with only 70% of the dividend credited. Below the groups: number of nights and the t of the net result.
Every night costs about 2 bps of spread plus 1.5 to 2.1 bps of swap and thereby eats the premium of 3 to 4 bps completely. No net value of the rule “long every night” differs from zero (|t| at most 1.4). The variant “only after high VIX”, which follows from the risk-premium thesis, changes nothing. Even with just 1 bp of spread the rule stays at +1.2 bps at most. Forward CFDs, which charge no swap, sit at zero because of their wider spreads (−0.96 to +0.18 bps). With futures, +1.0 to +2.2 bps per night would remain, but that is a calculation with model costs and not a test with real futures prices.
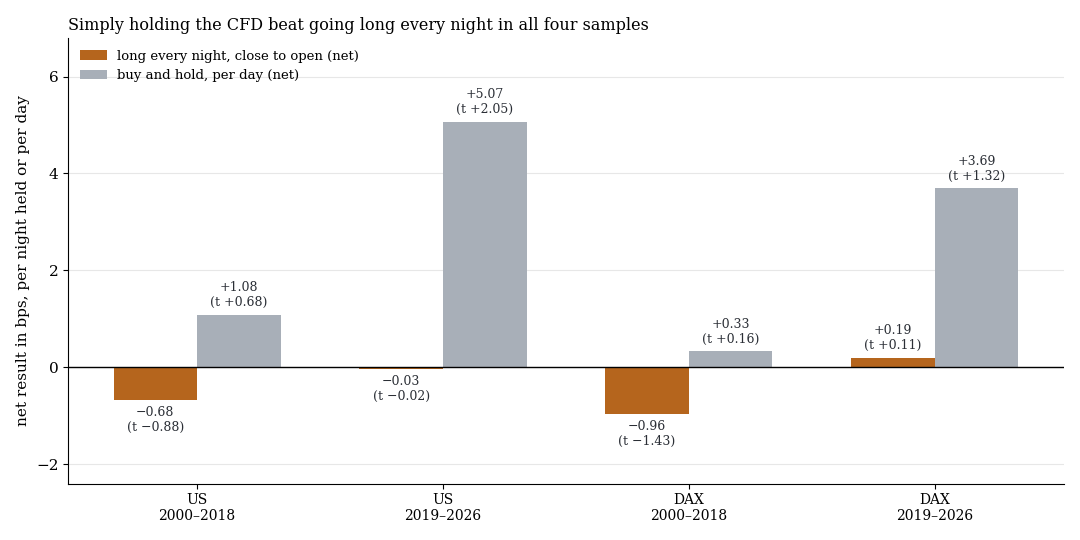
Net per night held (orange) and per day for buy and hold (grey), cash CFD. Buy and hold captures night and day, pays the same swap, but only one spread.
Whoever wants the premium gets it cheaper by simply holding on: buy and hold is ahead in all four samples, in the US holdout at +5.07 bps per day (t 2.05) against −0.03 bps per night. That is no strategy, it is index beta.
What it means
The overnight effect is a price finding, not a trading finding. It shows when the index rises, not how an account that pays spread and swap can capture it. Three things speak against it: the cost per night, a day that caught up in the holdout, and the fat loss tail of the night (worst nights −8 to −10%), which is exactly the risk an overnight holder carries.
Limits
- Official prices instead of CFD fills. Open and close are the official ETF and index prices. CFD open spreads are wider, so the CFD result is if anything too optimistic and still zero.
- ETF proxy and dividends. The US figures come from ETFs with ETF dividends instead of index dividends. The 70% dividend credit is an assumption (withholding tax).
- Swap model. The swap is computed on the entry value instead of the daily position value. Overnight rates (EFFR/SOFR, EONIA/€STR) serve as the reference rate instead of the 1-month rate Pepperstone names.
- Holdout only descriptive. No CFD rule was net positive in the search, so there was no candidate and no place in the global multiple-testing correction. The period 2019 to October 2026 was run once.
- Not tested: futures with real prices, other brokers, single stocks, leverage and drawdowns, markets other than US ETFs and the DAX.
All pattern families of the scan in the overview. Related: swing patterns after CFD financing, overnight drift, published anomalies net of costs.
📄 Full study as PDF: 7 pages incl. all tables, figures and limits (in German).
Disclaimer: Historical statistics are no guarantee of future market behaviour. This study is not investment advice. Trading carries a risk of loss up to total loss.