Data basis: Dow, Nasdaq 100 (NQ) and S&P 500 (SPX); Dukascopy CFD minute data (BID). Signal: the prior day's cash-session move (open at 09:30 New York time to 16:00) of at least 1 ATR (average true range), the mean daily range of the last 20 trading days. Trade on the next day against that direction, entry at the open, exit at 16:00. Search period 2015–2022 (241 signal days), holdout 2023 to 5 June 2026 (110 days), exactly one run. Costs per round trip: Dow 4.0, NQ 2.5, SPX 0.8 points. Figures are day means across the markets with a signal; the earlier study pooled all trades. Benchmarks: random market (every minute candle mirrored at its open with probability ½), “always long” on the same days. No trading recommendation.
After a very big day, the saying goes, the market turns the next day: investors overreact, and price recovers. In our study on gaps, shocks and levels this was the single observation among 2,435 rules. When a US index had moved at least 1 ATR from open to close, trading against that direction on the next day made +17.8 bps net per trade in the search period (t 2.21). In the holdout it was +24.2 bps (t 1.33), 65% of it from one day.
Now we split the same trades by the direction of the big day. That is after the fact: we made the split only after the holdout run. It describes days that already ran and is neither a new test nor a new rule.
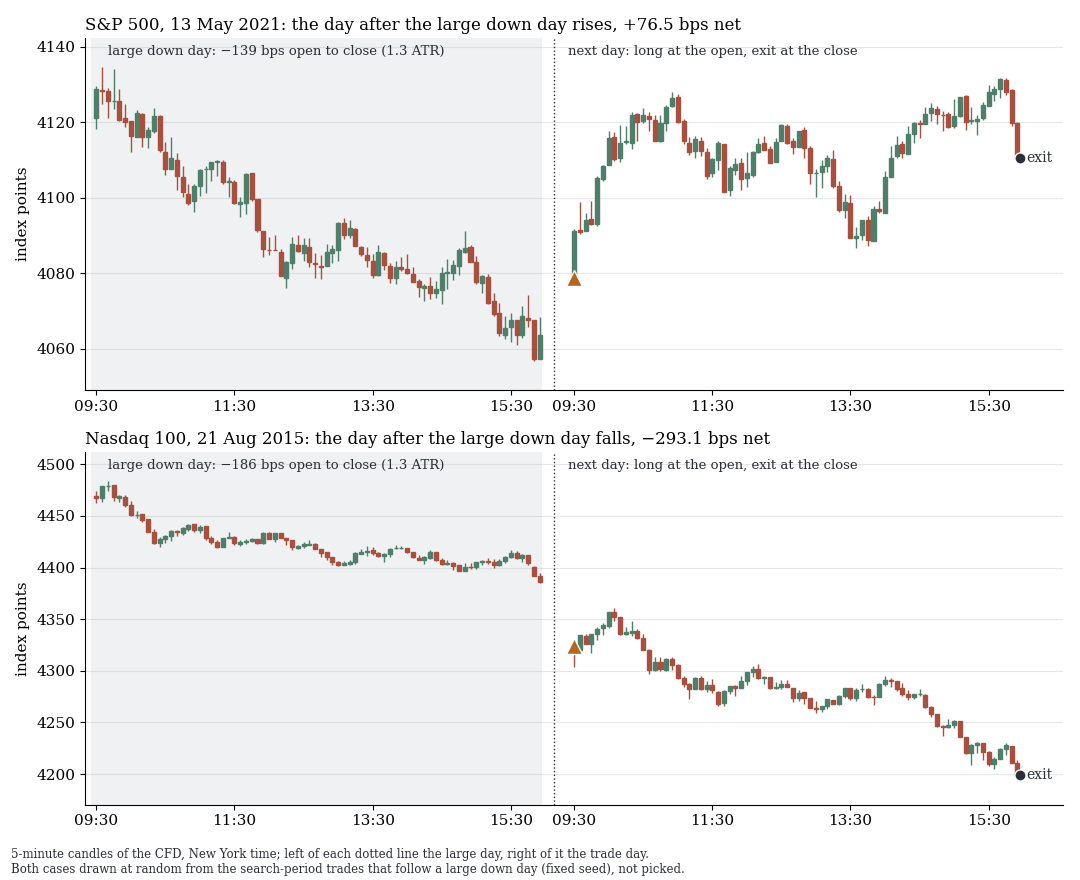
5-minute candles, New York time: the large down day on the left, the trade day on the right (long at the open, exit at the close). Drawn at random from the search-period trades (fixed seed). The losing day is among the three worst days of the search period.
1. After up days nothing, after down days a rebound on average
| Next day | Period | Days | net per day | t | median | without the 5 best days | hit rate |
|---|---|---|---|---|---|---|---|
| after a down day, long | search period | 139 | +20.9 bps | 2.32 | +17.7 | +9.5 | 59% |
| after a down day, long | holdout | 53 | +27.6 bps | 1.26 | +7.8 | −5.6 | 57% |
| after an up day, short | search period | 102 | +6.5 bps | 0.62 | −5.6 | −7.9 | 46% |
| after an up day, short | holdout | 57 | +1.9 bps | 0.15 | −4.4 | −17.3 | 47% |
After up days the short side stays at t 0.62 and 0.15, and the median day loses 5.6 and 4.4 bps. After down days the mean is +20.9 and +27.6 bps. In the holdout the median is only +7.8 bps, and without the five best days the mean is −5.6 bps. Both directions together: +14.8 bps (t 2.17) in the search period, +14.3 bps (t 1.15) in the holdout.
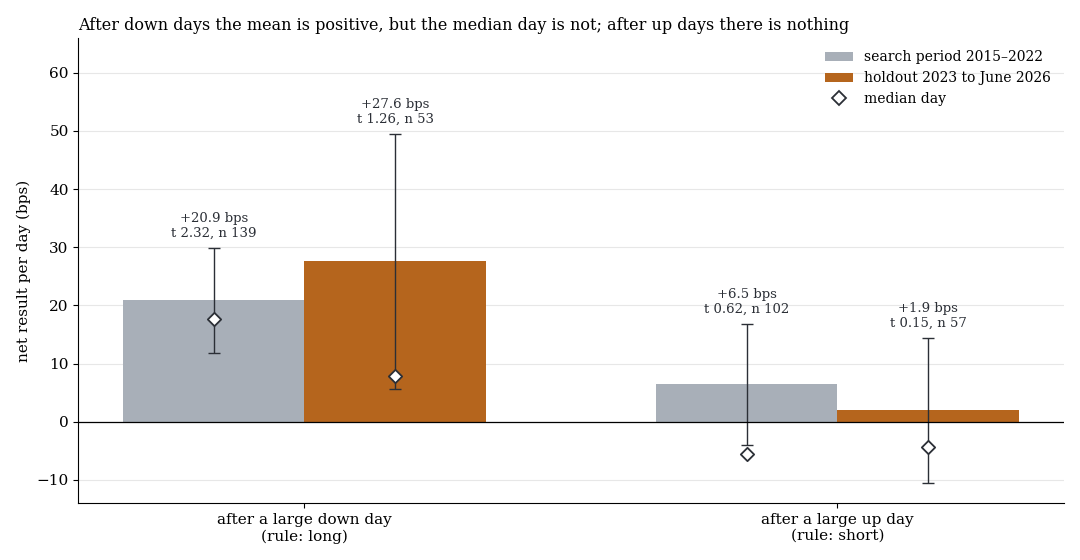
Mean net result per day with one standard error, plus the median day (diamond).
2. The rebound hangs on a few panic days
In the holdout one day, 9 April 2025 (+1,028 bps, the recovery after the tariff pause), supplies 65% of the total of all 110 days. The five best days, all between 28 February and 9 April 2025, supply 138%, so the rest is net negative. Three of four years are negative; only 2025 is positive (+83.9 bps per day). In the search period five days supply 51%. The rule has no stop; its worst days were −198 bps (holdout) and −371 bps (search period).
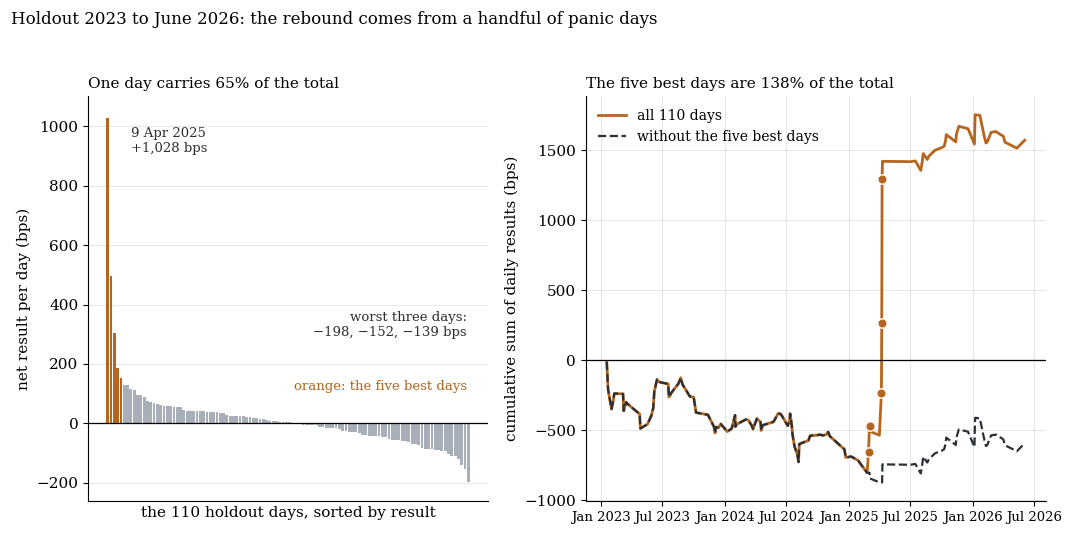
Holdout 2023 to June 2026, daily results net in bps. Right: cumulative sum, the five best days in orange.
3. No mechanism, and “always long” explains most of the holdout
Rebalancing of leveraged ETFs would be the obvious explanation: on the big day they would have to trade in the day's direction into the close, and price recovers the next day. The test found no same-day follow-through in the day's direction (net t −1.3 to +0.2). Pooled over all trades, “always long” on the same days would have made +16.7 bps gross in the holdout (the rule +25.6), carried by 9 April 2025, and only +6.8 in the search period (the rule +20.5). The rule's edge over it is +8.9 and +13.6 bps net. On a random market the rule returns −1.4 bps gross.
What it means
The rule from the earlier study is not a steady edge after big days but a lottery on V-shaped panic episodes: rare, very large gains, otherwise slightly negative on average. After up days there is nothing to collect.
Limits
- Split after the fact. It describes the holdout that already ran and tests nothing.
- Small holdout. 110 days, and the April 2025 outliers inflate the standard errors. An effect the size of the search period would have had only about a 25% chance of p below 0.05: not confirmed does not mean refuted.
- Fixed cost model. At panic opens real spreads are wider.
- Data gap. From September 2017 to April 2018 the US feed lacks bars from 16:00 (55 trades); with a realistic exit the earlier study's search-period t falls from 2.21 to 2.02.
- Not tested: other thresholds and stops in the holdout, tick fills at panic opens. We chose the direction (reversal rather than following the move) from the data.
All pattern families of the scan in the overview. Related: gaps, shocks and levels, RSI(2) dip buying on index CFDs in the holdout, published anomalies net of costs.
📄 Full study as PDF: 7 pages incl. all tables, figures and limits (in German).
Disclaimer: Historical statistics are no guarantee of future market behaviour. This study is not investment advice. Trading carries a risk of loss up to total loss.