Data basis: 15 markets (DAX, FTSE, CAC, SMI, Dow, NQ, SPX, JPN225, HK50, AUS200, gold, EURUSD, GBPUSD, USDJPY, BTCUSD); Dukascopy CFD minute data (BID), search period 2015–2022 (JPN225 from 2018, AUS200 from 2016). Only the one observation ran on the holdout, exactly once, 2023 to 5 Jun 2026. Costs per round trip from a fixed model, for example DAX 2.5, FTSE 1.5, Dow 4, NQ 2.5, SPX 0.8 points, gold 0.40 USD, EURUSD 1.3, GBPUSD 2.0, USDJPY 1.6 pips; indices outside cash hours ×2.5. Benchmarks: random walk, placebo levels, a random market (each minute candle mirrored at its open with probability ½). No trading recommendation.
The first half hour predicts the last (Gao, Han, Li and Zhou). Gaps get filled. After extreme minutes price turns. Prior-day high, prior close and round numbers act as magnet or resistance because orders sit there (Osler). We measured these claims and their neighbours broadly: 2,435 rules, almost all with a time exit. Every rule also ran on a random market, levels additionally against placebo levels. The study is part of a scan with about 893,000 logged tests.
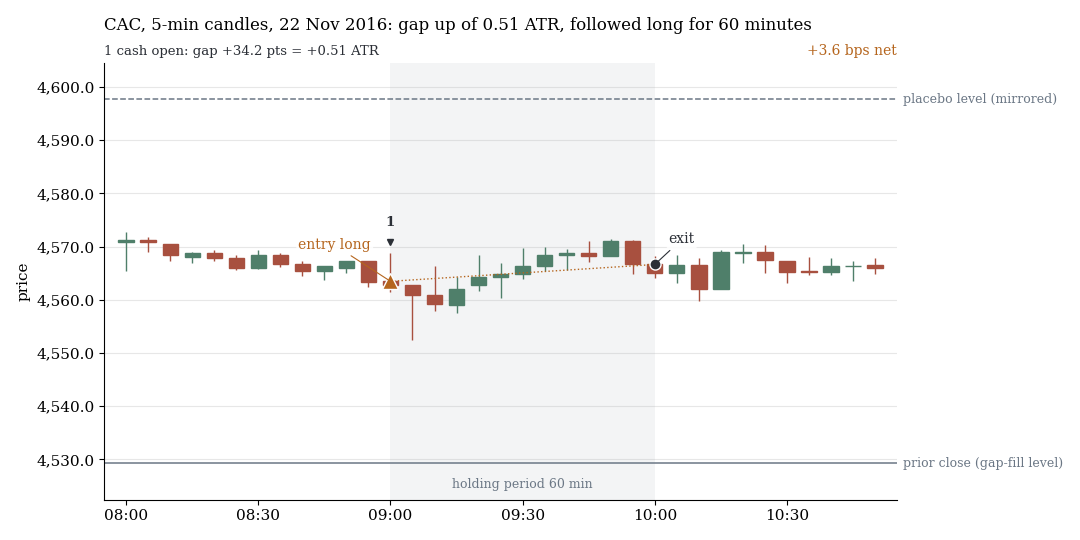
CAC, 5-minute candles, 22 Nov 2016: the cash session opens 0.51 ATR above the prior close (bottom; mirrored placebo level dashed at the top). 60 minutes in the gap direction (grey): +3.6 bps net. Drawn at random from all detected cases (fixed seed, not picked), search period 2015–2022.
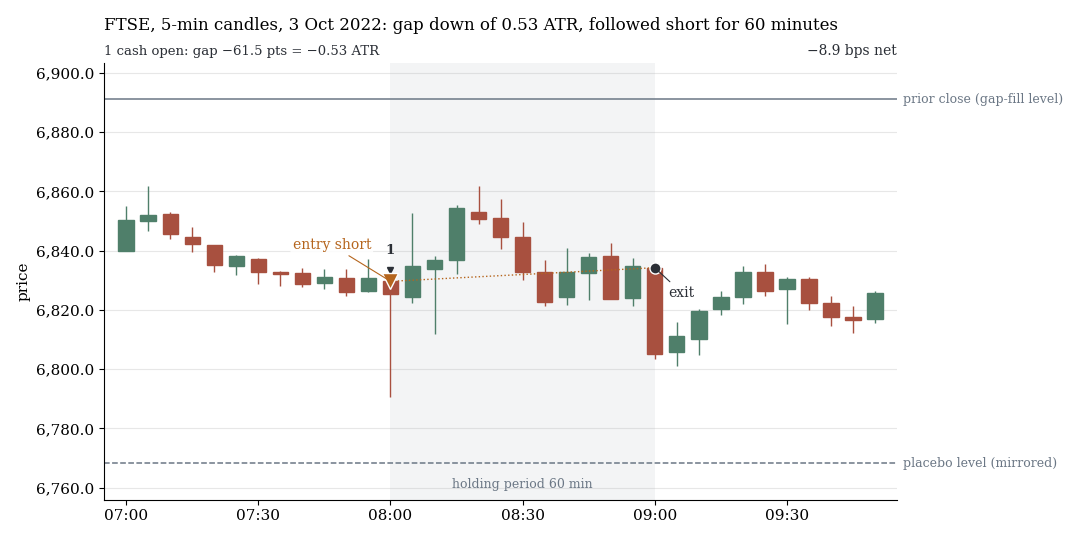
FTSE, 3 Oct 2022, same rule: gap down of 0.53 ATR, 60 minutes short, −8.9 bps net. Also drawn at random.
The family at a glance
| Question | Rules | best net t |
|---|---|---|
| Momentum and reversal at fixed times | 908 | 1.51 |
| Prior-day move against today | 60 | 2.21 |
| Gaps | 300 | 2.26 |
| One-minute shocks | 703 | 2.09 |
| Range, position in range, opening range | 123 | 2.21 |
| Price levels | 120 | 0.49 |
| Autocorrelation by time of day and regime | 180 | below 2 |
Plus 41 verification runs of the candidates (total 2,435).
1. Momentum and the late session: real, but smaller than the costs
The momentum of Gao, Han, Li and Zhou does not exist in the US indices in 2015–2022: the sign is reversed (+1.35 bps gross when fading, t 1.88, −1.3 bps net). What exists is small. The last half hour of the EU indices follows the move since the prior close with 1.50 bps gross (t 3.93) against 3.05 bps costs, and one year in eight is positive net. The last ten minutes of the US indices follow the day's trend with 1.1 to 1.9 bps gross against 2.6 bps costs. FX and gold show mean reversion in 5- to 15-minute returns (gross t up to 7.6), but 0.03 to 0.17 bps per trade against 1.1 to 2.9 bps costs.
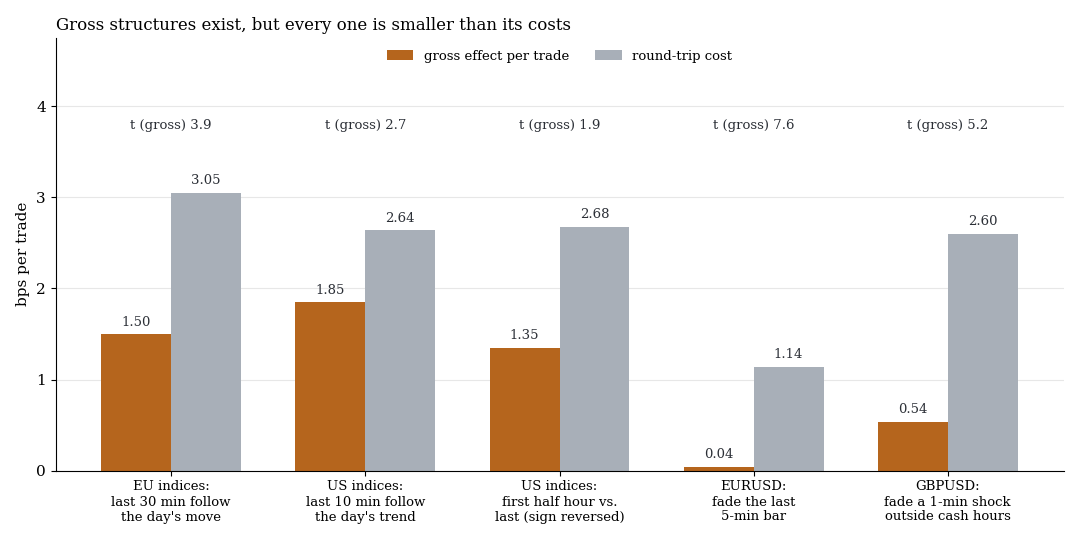
Five gross structures of the family, search period 2015–2022. Orange: mean effect per trade, grey: costs, above it the gross t value.
2. Gaps: fill rates like at the placebo level
| Gap in ATR (EU indices) | n | fills within 60 min | Placebo level | t |
|---|---|---|---|---|
| 0.05–0.15 | 1,746 | 73.1% | 67.5% | 2.7 |
| 0.15–0.30 | 2,074 | 39.4% | 40.4% | −0.4 |
| 0.30–0.60 | 2,295 | 12.8% | 18.0% | −3.4 |
| 0.60–1.00 | 779 | 3.0% | 6.4% | −2.4 |
| from 1.00 | 238 | 0.4% | 0.8% | −0.6 |
Gap fill is mostly a random walk. Small gaps fill slightly more often than the placebo, medium ones less often: a slight continuation. Trading medium EU gaps (0.3 to 0.6 ATR) in their direction makes +1.71 bps net (t 1.24, four of eight years positive). 26 of 200 gap rules reach |t gross| ≥ 2, against 11 and 10 in the random market. The best rule, a HK50 fade after gaps of 0.3 to 0.6 ATR, makes +4.9 bps net (t 2.26), but its first half sits at 0.25 bps, and with 1 to 2 minutes of delay +1.8 and +1.4 bps remain (t 0.85 and 0.68). The gain probably comes from the first print after the open.
3. Shocks, range, opening range: chance level
After extreme one-minute moves the cash session shows no reversal that covers the costs. At round minutes continuation dominates: gold, |z| ≥ 6, 60 minutes with the shock, 9.2 gross, 6.3 bps net, t 2.09, n 176. Across all ten groups with 2 minutes of delay, −0.6 bps after 30 and +0.1 bps after 60 minutes remain (t −0.44 and 0.04). Opening-range breaks over 5, 15 and 30 minutes sit at |t| ≤ 1.9 gross in EU, US, Japan and Hong Kong. A price in the top or bottom tenth of the day's range at 12:00 ET carries +6.3 bps net to the close in the US indices (t 2.21), but without a plateau: at later times the same rule is negative net.
4. Levels: magnet and bounce like at random levels
We tested prior-day high/low, prior close, overnight extremes, weekly open and round numbers twice: is the level touched more often than a placebo level at the same distance? And what follows the first touch? The touch rate real minus placebo lies between −4.5 and +5.4 percentage points in 30 tests, almost always with |t| < 2. Two outliers (HK50 prior close, JPN225 overnight) are expected among 30 tests. On the first touch none of 90 rules reaches net t 2. Following price through the level comes to −1.54 bps net at the US prior-day high/low (15 minutes, t −3.34) and to −2.20 bps at the EU prior close (30 minutes, t −3.86).
5. Round numbers: the teaching is reversed
Osler (2003, 2005) says two things: trends reverse more often at round numbers than at arbitrary levels, and after crossing the move is larger. We measured this at the first touch of a round level per day (EURUSD, GBPUSD, USDJPY, gold; multiples of 0.0100, 1.00 yen and 10 USD; placebo: the same grid shifted by a quarter or three quarters of a step). A bounce means: within 60 minutes price first reaches 10 bps on the side it came from.
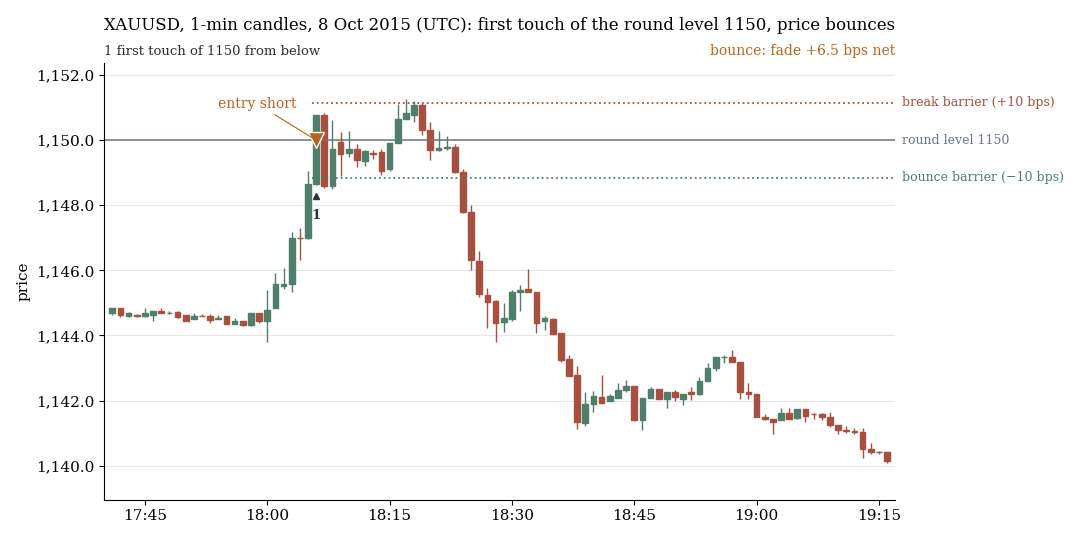
Gold, 8 Oct 2015, UTC: first touch of 1150 from below. A bounce, because the lower barrier (−10 bps) is reached first, one minute later; the later rise above the upper barrier does not count. Fade at the level: +6.5 bps net. Drawn at random, search period.
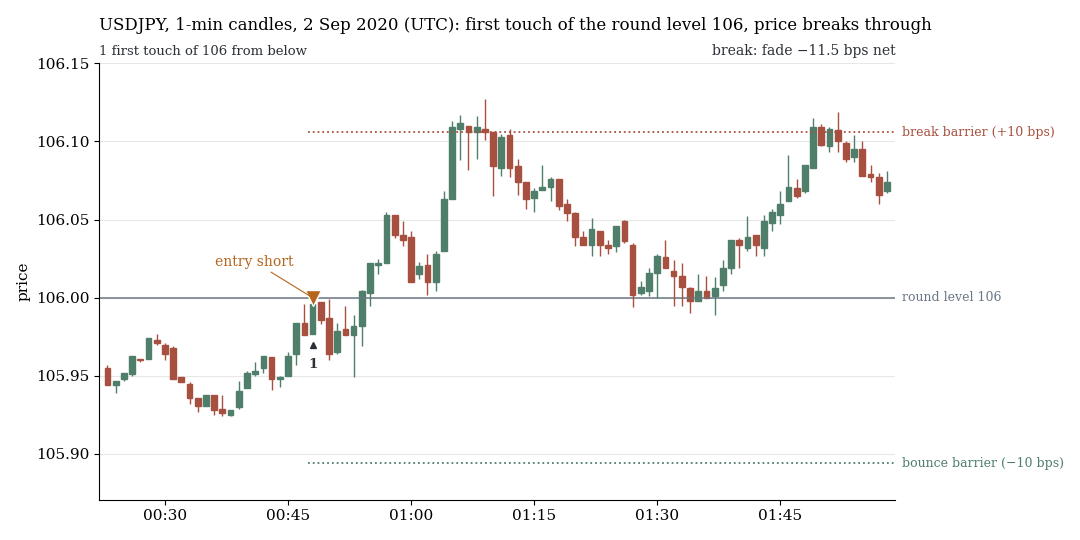
USDJPY, 2 Sep 2020, UTC: first touch of 106 from below. The upper barrier (+10 bps) is reached after about 17 minutes, the lower one never: a break. Fade at the level: −11.5 bps net.
Round levels bounce less often: 43.8% against 47.5% at placebo levels (n 9,474 against 19,502, t −5.3, in all eight years). In a random market there is no such gap (+0.5 percentage points, t 0.6). A fade at the level costs −2.8 bps net, a follow trade after the cross −1.6 bps. Osler's second prediction holds gross (+0.89 bps in 15 minutes, t 4.0), but under the costs. In the indices there is neither a bounce nor a break beyond the placebo.
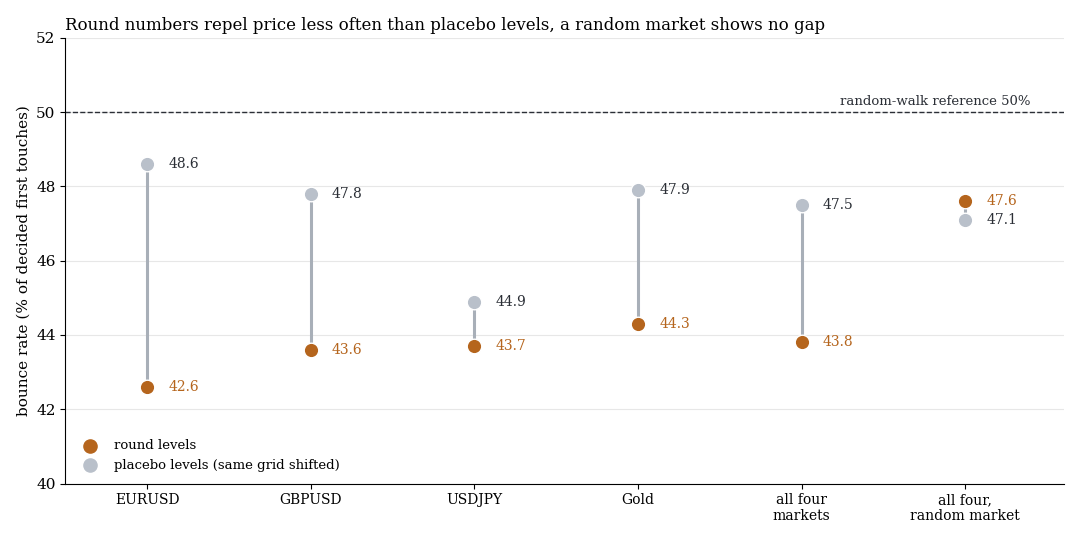
Share of bounces among decided first touches (about 18% run into the time limit). Orange: round levels, grey: placebo levels.
6. The one observation: reversal after a big US day
If a US day moved at least 1 ATR from open to close, we trade against that direction the next day, from the open to the close (Dow, NQ, SPX). Search period: n 485 on 241 days, +17.8 bps net (20.5 gross), t 2.21, eight of eight years positive, −1.4 bps gross in the random market. Without the five best days t 1.27. Rebalancing of leveraged ETFs as an explanation could not be confirmed.
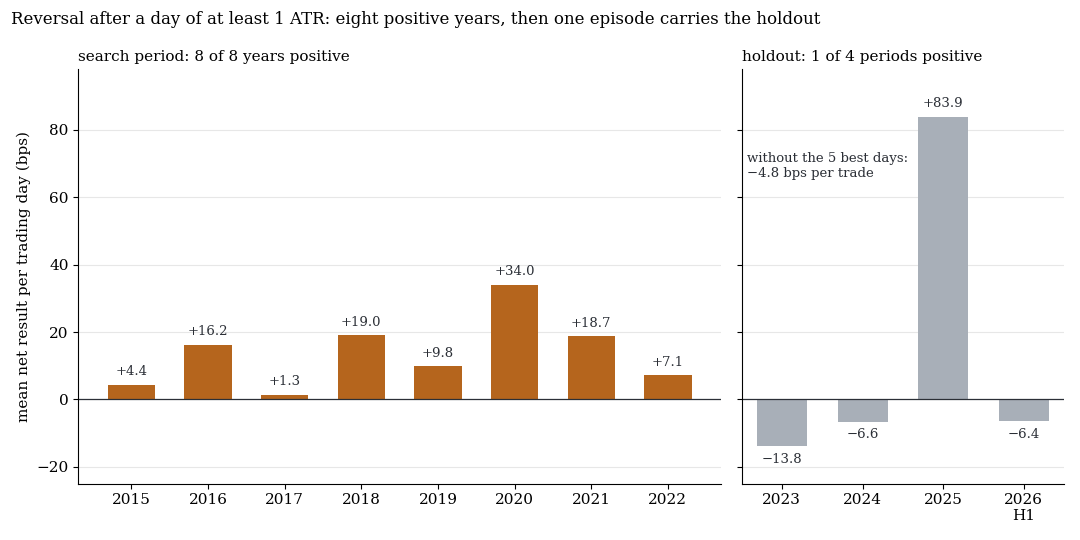
Mean net result per trading day and year. Left: search period 2015–2022, right: holdout 2023 to Jun 2026.
In the holdout: n 197 on 110 days, +24.24 bps, t 1.33, one-sided p 0.09. 9 Apr 2025 alone delivers 65% of the sum, the five best days 138%. Without them it is −4.81 bps (t −0.71). The rule has no stop: single days lose −198 bps in the holdout and −371 bps in the search period.
What it means
Price dynamics on the minute scale are not empty, but small: autocorrelation, late continuation and micro-reversal sit under the costs. Levels are not special places for price. Touch and bounce match random levels, and in FX and gold round numbers even break more often than placebo levels. The one observation is a crash-reversal lottery: rare, very large gains in V-shaped panic episodes, slightly negative otherwise.
Limits
- CFD minute data (BID). Spread widening shows up as BID movement (EU auction window, shocks outside cash hours). The HK50 opening print is not tradeable.
- Fixed cost model. Real costs at the open, on news and on panic days are higher. The null results stay because gross effects are mostly below the costs.
- Small samples. JPN225 only from 2018, AUS200 2016–2018 and HK50 2017–2018 with reduced coverage; the US reversal has 241 independent days.
- Weak holdout. With 110 days, an effect of the search-period size had only about a 25% chance of p < 0.05. “Not confirmed” is not “refuted”.
- Not tested: multi-signal combinations, cross-market signals, scheduled macro events, tick and order-book data, real volume, stop-and-target variants, multi-day holding. Follow or fade was chosen from the data. With 2,435 rules a single find needs about net t ≥ 4.1.
All pattern families of the scan in the overview. Related: opening range breakout, paper replication, intraday momentum, paper replication, the first candle.
Disclaimer: Historical statistics are no guarantee of future market behaviour. This study is not investment advice. Trading carries a risk of loss up to total loss.