Data basis: Imbalance messages of the Nasdaq closing cross (Net Order Imbalance Indicator, via Databento) for 20 large Nasdaq 100 stocks, only 15:45 to 16:01 New York. Prices: NAS100 CFD, Dukascopy minute data. Search period 1 May 2018 to 30 December 2022, separate holdout 2 January 2023 to 5 June 2026, run exactly once. Costs per round trip 2.5 index points, on average 2.5 bps in the search period (1 bp = 0.01%). Benchmarks: randomly swapped direction (2,000 times), always long on the same days, random markets. Rules, thresholds and gates were fixed before the data was bought (pre-registration of 19 October 2026, locked with SHA-256 checksum 441dd24d…). No trading recommendation.
The closing auction is the largest single trade of the day. Index funds and other investors who need the official closing price send market-on-close orders there. From 15:50, Nasdaq publishes for every stock which side currently has more volume waiting. It is one of the few forced flows whose direction is public before the event. The obvious idea: if the large Nasdaq names together have much more to buy than to sell, the index should rise into the close.
We had already tested this at the level of the index ETFs, without result (see SPY and QQQ). Here we go one level deeper, to the single stocks whose auctions carry most of the flow.
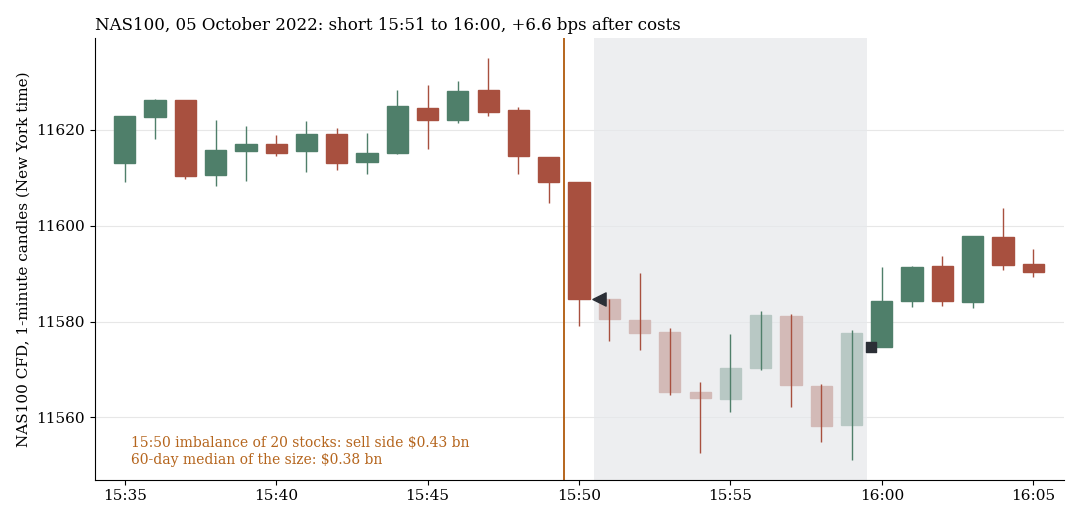
5 October 2022: at 15:50 the 20 stocks report a combined sell imbalance of USD 0.43 bn, above the median of the previous 60 days. Short from 15:51 to 16:00, +6.6 bps after costs.
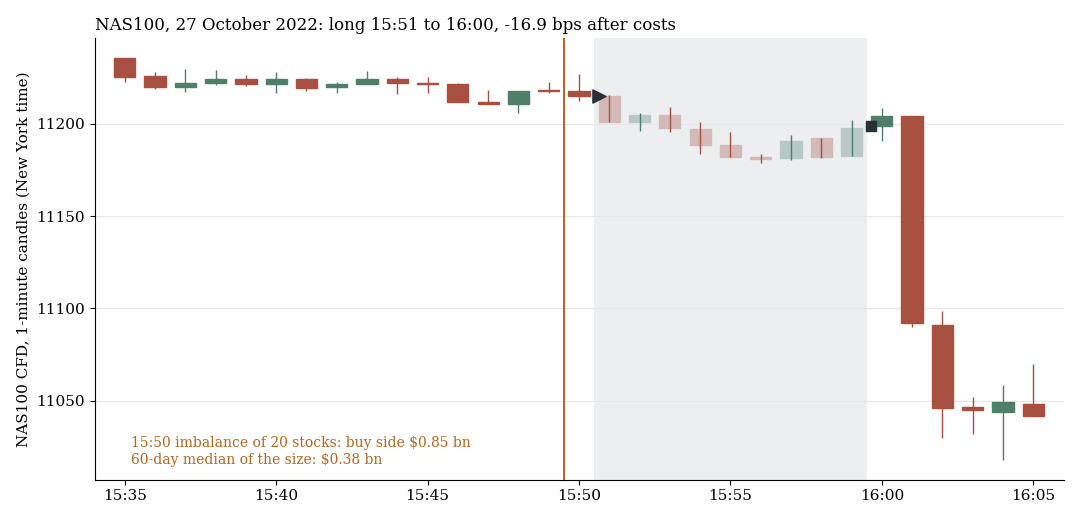
27 October 2022: USD 0.85 bn buy imbalance, long, −16.9 bps. The drop after 16:00 comes after the exit. Both days were drawn at random with a fixed seed (7) from a search-period month that was itself drawn at random (October 2022, ten signal days, two of them positive).
1. Rule and pre-registration
| Element | Specification |
|---|---|
| Stocks | AAPL, MSFT, NVDA, AMZN, GOOGL, GOOG, META (FB until June 2022), AVGO, TSLA, COST, NFLX, AMD, PEP, ADBE, CSCO, QCOM, INTU, AMGN, TXN, ISRG |
| Signal | per stock the first closing-auction message from 15:50:00; sum of side (buy +1, sell −1) × imbalance shares × reference price in USD |
| Direction | sign of the sum |
| Size | absolute sum against the previous 60 days: all days, from the median, from the 75th percentile |
| Trade | NAS100 CFD, entry at the 15:51 open, exit at the 16:00 open (before the auction print) or 16:01 (after it) |
| Primary rule | from the median, exit 16:00 |
| Gate to the holdout | primary rule net t ≥ 2 and Benjamini-Hochberg q ≤ 0.10 across the six variants |
| Holdout verdict | one-sided p < 0.05, net positive also at 1.5× costs, global correction across all holdouts q ≤ 0.10 |
One addendum before the first data row: Meta traded as FB until 8 June 2022, so we load FB before that date. Nothing else changed. The t measures how far a mean sits above the noise (2 or more is notable). The q is the error probability adjusted for the number of tests.
2. The search period: the gate was passed
| Size | Exit | n | net bps | t | gross bps |
|---|---|---|---|---|---|
| all days | 16:00 | 1,167 | −0.03 | −0.04 | +2.51 |
| all days | 16:01 | 1,167 | −1.02 | −1.41 | +1.51 |
| from median | 16:00 | 569 | +3.15 | +2.60 | +5.63 |
| from median | 16:01 | 569 | +1.27 | +1.12 | +3.75 |
| from 75th pct. | 16:00 | 296 | +5.47 | +3.01 | +7.97 |
| from 75th pct. | 16:01 | 296 | +3.10 | +1.76 | +5.60 |
The primary rule reached +3.15 bps per trade net at t 2.60 and q 0.014. Gross it was +5.63 bps (t 4.63). The benchmarks favoured it: with randomly swapped direction the mean was −2.43 bps, and none of the 2,000 swaps was as good as the real direction. Always long on the same days made −0.98 bps gross, and on the two random markets the same rule lost −6.25 and −2.47 bps. Larger imbalances delivered more. The exit after the print was weaker, so the move came before the auction, not in it.
3. What looked doubtful before the holdout
After the gate was passed and before the holdout, we broke the primary rule down descriptively. That changes no rule, but shows what the result rests on.
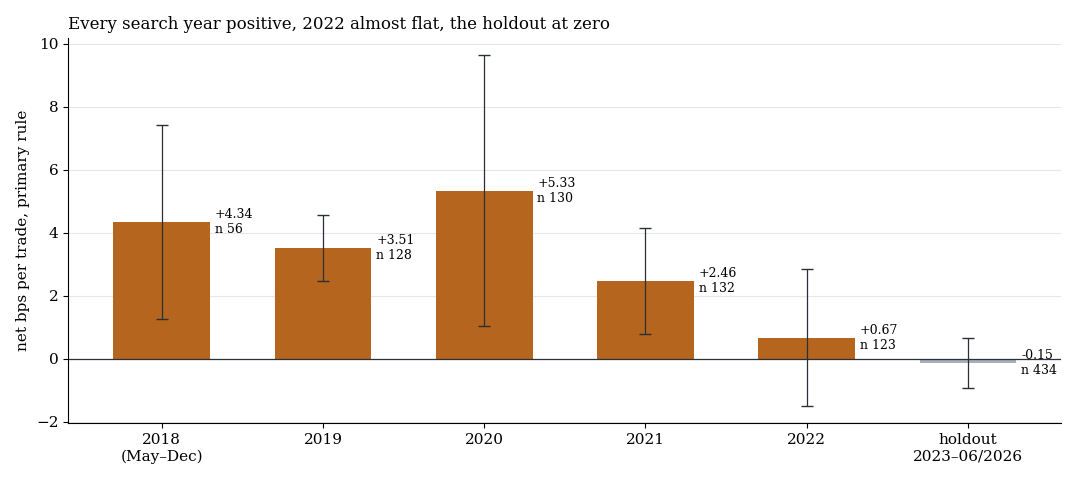
Net per trade with one standard error. All five search years are positive, 2022 only barely. The holdout sits at zero.
- Years: 2018 (from May) +4.34, 2019 +3.51, 2020 +5.33, 2021 +2.46, 2022 +0.67 bps. Only 2019 on its own is notable, at t 3.35.
- Direction: long +2.29 bps (t 1.31), short +3.95 bps (t 2.35).
- Outliers: without the best 1% of days (six days above 75 bps) +1.47 bps remain at t 1.58. The median trade is +1.25 bps, the hit rate 52.4%.
- Expiry days: on the third Friday of the month +1.45 bps (34 days), otherwise +3.26 bps.
An effect that half depends on a few large days and has almost vanished in the last search year is a weak candidate. The holdout exists for exactly this question.
4. The holdout: at zero
The holdout ran exactly once on 19 October 2026, with the unchanged rule and a lock file.
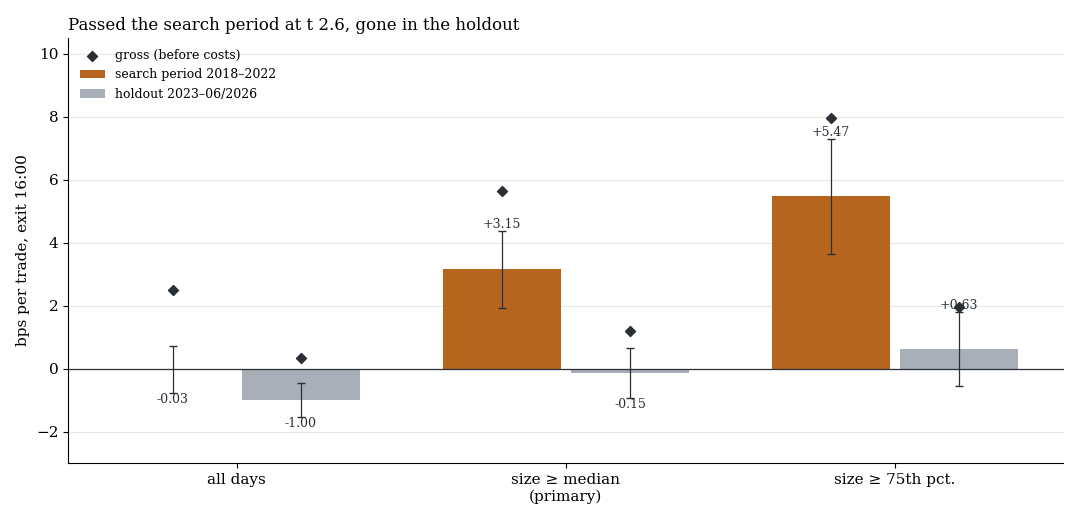
Net per trade with one standard error (bars) and gross before costs (diamonds), exit 16:00. In the holdout the gross information falls from +5.6 to +1.2 bps, and nothing is left after costs.
| Size | Exit | n | net bps | t | gross bps |
|---|---|---|---|---|---|
| all days | 16:00 | 851 | −1.00 | −1.84 | +0.35 |
| from median | 16:00 | 434 | −0.15 | −0.19 | +1.20 |
| from median | 16:01 | 434 | −0.66 | −0.76 | +0.69 |
| from 75th pct. | 16:00 | 232 | +0.63 | +0.54 | +1.97 |
At 1.5× costs the primary rule is at −0.82 bps. Against randomly swapped directions it is no longer clearly better (p 0.09), and on the random markets it loses −1.87 and −2.70 bps. In the global multiple-testing correction across the programme's 82 holdout tests so far, q is 0.81. Verdict: not confirmed.
The holdout has enough trades to rule out the size seen in the search period. With a standard error of 0.79 bps, a true effect of +3.15 bps would have produced a t of about 4. It does not rule out a small remainder of about 1 bp gross, but after costs that would not be tradable.
What it means
The closing-auction imbalance carried measurable directional information for the last nine minutes from 2018 to 2021. From 2022 it has almost disappeared, and in the holdout about one basis point is left gross, less than half the costs. Whether the market learned or the search period was a lucky window cannot be separated.
The study also shows what a holdout is for. A passed gate at t 2.6 and q 0.014 is a candidate, not a finding. The descriptive warning signs (outliers, a weak last year) were visible before the holdout, and the holdout confirmed them. Across the whole programme, after the global correction, two rules remain confirmed: the FTSE index event day in the closing auction and RSI(2) dip buying on US index CFDs.
Limits
- Survivorship. The list is today's largest 20 names. In 2018 the top of the index looked different, and the list favours companies that grew. The 20 stocks cover about two thirds of the index weight.
- First message only. We use the first message from 15:50, not how it changes until 15:59 and not the paired volume.
- CFD instead of auction price. The CFD follows the Nasdaq futures. Trading the stocks directly in the auction would measure something else.
- Costs. A fixed 2.5 points per round trip, at normal spreads around 15:51. Half trading days without a 15:50 message drop out.
- Not tested: other stock lists, weighting by index share, single stocks as the traded instrument, the opening auction at stock level.
All pattern families of the scan in the overview. Related: SPY closing auction, QQQ closing auction via Nasdaq and the one confirmed auction finding, index event days in the FTSE 100.
📄 Full study as PDF: 8 pages incl. all tables, figures and limits (in German).
Disclaimer: Historical statistics are no guarantee of future market behaviour. This study is not investment advice. Trading carries a risk of loss up to total loss.