Data basis: Imbalance messages of the Nasdaq closing cross (Net Order Imbalance Indicator, via Databento) for QQQ, only 15:45 to 16:01:30 New York. Prices: NAS100 CFD, Dukascopy minute data. Search period 1 May 2018 to 30 December 2022. The holdout from 2023 stayed untouched because the gate was missed. Costs per round trip 2.5 index points, on average 2.5 bps (1 bp = 0.01%). Benchmarks: randomly swapped direction (2,000 times), always long on the same days, random markets. Pre-registered on 19 October 2026 before the QQQ data was bought (SHA-256 902e1b32…). No trading recommendation.
This study corrects a mistake of our own. In the SPY closing-auction study we had taken QQQ from NYSE Arca. QQQ, however, is listed on Nasdaq, and the Arca auction for QQQ is practically empty: the median paired volume was four shares. The QQQ rows of that test were therefore worthless. Here is the same test with the messages of the home exchange.
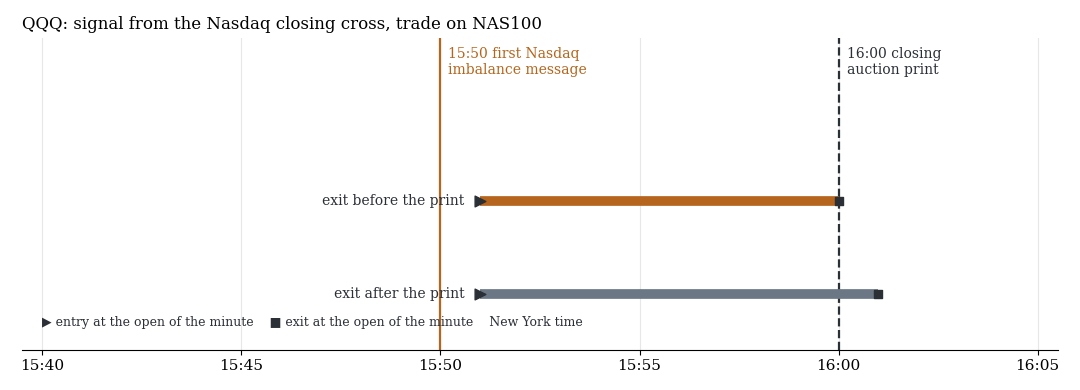
The same rule as for SPY: first message from 15:50:00, entry at 15:51 in the direction of the imbalance, exit before or after the auction print.
1. Rule
Each day the first message of the Nasdaq closing cross from 15:50:00 counts. A buy imbalance means long, a sell imbalance short, and days without an imbalance side drop out. Size against the previous 60 signal days: all days, from the median, from the 75th percentile. Exit at 16:00 or 16:01. Primary rule: from the median, exit 16:00. Gate: net t ≥ 2 and q ≤ 0.10 across six tests (q is the error probability adjusted for the number of tests). Because SPY had already been negative before costs, expectations were low. We did not change the rule because of that.
2. Result
| Size | Exit | n | net bps | t | gross bps |
|---|---|---|---|---|---|
| all days | 16:00 | 884 | −1.26 | −1.47 | +1.24 |
| from median | 16:00 | 557 | −0.76 | −0.69 | +1.71 |
| from 75th pct. | 16:00 | 301 | −0.95 | −0.64 | +1.51 |
| all days | 16:01 | 884 | −1.61 | −1.92 | +0.89 |
| from median | 16:01 | 557 | −1.58 | −1.40 | +0.89 |
| from 75th pct. | 16:01 | 301 | −1.69 | −1.09 | +0.78 |
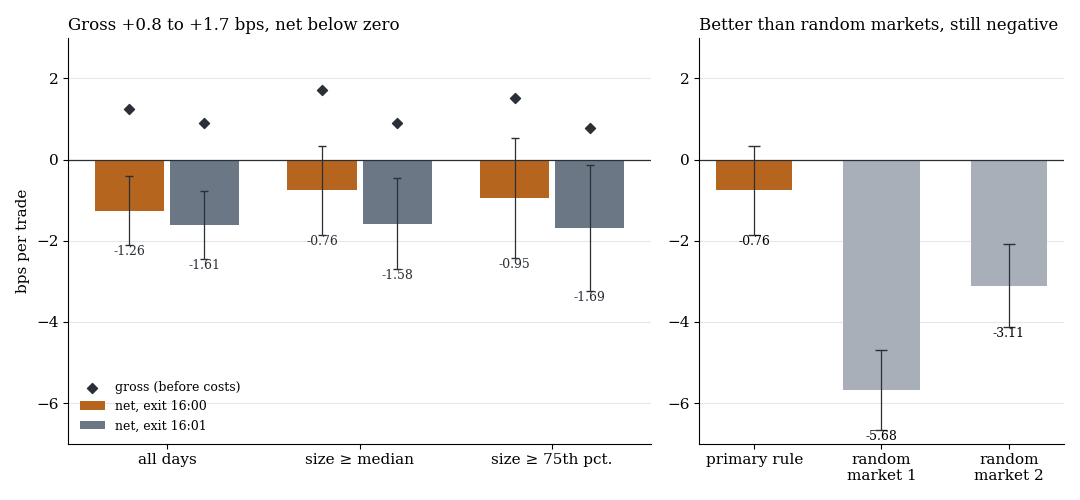
Left: net per trade with one standard error, gross as a diamond. Right: the primary rule against the same rule on two random markets.
Unlike SPY, the gross result is positive, but at +1.2 to +1.7 bps it is smaller than the costs. Always long on the same days made +1.43 bps gross, almost the same as the rule. Against randomly swapped directions (mean −2.28 bps) the real direction is only weakly better (p 0.08). On two random markets the same rule loses −5.68 and −3.11 bps, so the real rule loses less. A small remnant of directional information is possible, but after costs it stays negative.
What it means
At ETF level the closing-auction imbalance carries no tradable edge, neither for SPY nor for QQQ. The QQQ auction is also only a small part of the flow in the Nasdaq 100 names. We tested the level below, the auctions of the large single stocks, separately: it passed the search period and failed in the holdout (20 Nasdaq heavyweights).
Limits
- CFD instead of auction price. The NAS100 CFD follows the Nasdaq futures, not the QQQ price in the auction.
- First message only. Changes until 15:59 and the paired volume are not used.
- Costs. A fixed 2.5 points per round trip. Half trading days without a 15:50 message drop out.
- Not tested: other Nasdaq ETFs, trading in the auction itself, holding beyond 16:01.
All pattern families of the scan in the overview. Related: QQQ opening auction via Nasdaq and index event days in the FTSE 100.
📄 Full study as PDF: 5 pages incl. all tables, figures and limits (in German).
Disclaimer: Historical statistics are no guarantee of future market behaviour. This study is not investment advice. Trading carries a risk of loss up to total loss.