Data basis: Imbalance messages of the Nasdaq opening cross (Net Order Imbalance Indicator, via Databento) for QQQ, only 09:20 to 09:31:30 New York. Prices: NAS100 CFD, Dukascopy minute data. Search period 1 May 2018 to 30 December 2022. The holdout from 2023 stayed untouched because the gate was missed. Costs per round trip 2.5 index points during the cash session (on average 2.4 bps, 1 bp = 0.01%), 2.5 times that before the open. Benchmarks: randomly swapped direction (2,000 times), always long on the same days, random markets. Pre-registered on 19 October 2026 before the QQQ data was bought (SHA-256 902e1b32…). No trading recommendation.
In the SPY opening-auction study one observation stood out: the larger the imbalance, the better trading in its direction worked in the first half hour, up to +4.9 bps before costs. That was not the pre-registered primary rule. Before believing something like that, you need a second market. QQQ has no opening auction on NYSE Arca (that was our mistake in the first test), but it does on Nasdaq.
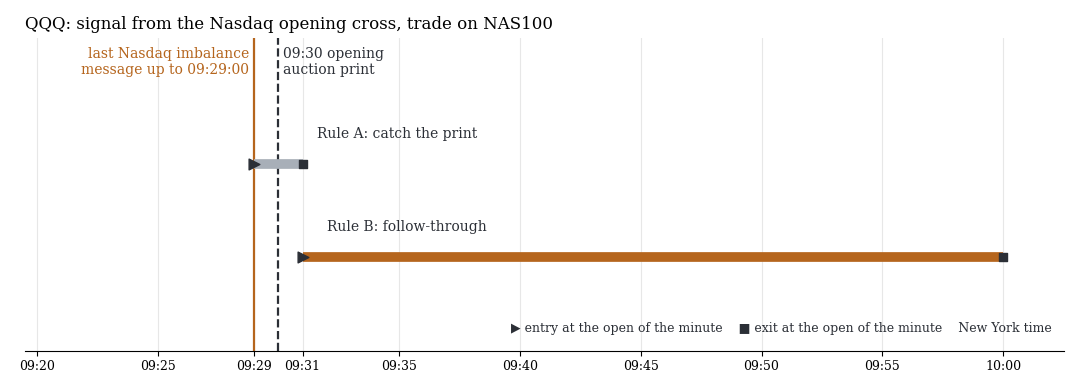
The same two rules as for SPY, with Nasdaq messages and the NAS100 CFD.
1. Rule
Each day the last opening-auction message until 09:29:00 counts. A buy imbalance means long, a sell imbalance short, and days without an imbalance side drop out (for QQQ that is the case on many days). Size against the previous 60 signal days. Rule A: 09:29 to 09:31 with pre-open costs. Rule B: 09:31 to 10:00. Primary rule: B from the median. Gate: net t ≥ 2 and q ≤ 0.10 across six tests.
2. Result
| Rule | Size | n | net bps | t | gross bps |
|---|---|---|---|---|---|
| A (print) | all days | 564 | −6.69 | −10.65 | −0.71 |
| A (print) | from median | 478 | −6.73 | −9.69 | −0.80 |
| A (print) | from 75th pct. | 278 | −6.70 | −7.12 | −0.62 |
| B (follow-through) | all days | 566 | −4.90 | −2.30 | −2.50 |
| B (follow-through) | from median | 480 | −4.28 | −1.83 | −1.90 |
| B (follow-through) | from 75th pct. | 279 | −7.22 | −2.19 | −4.78 |
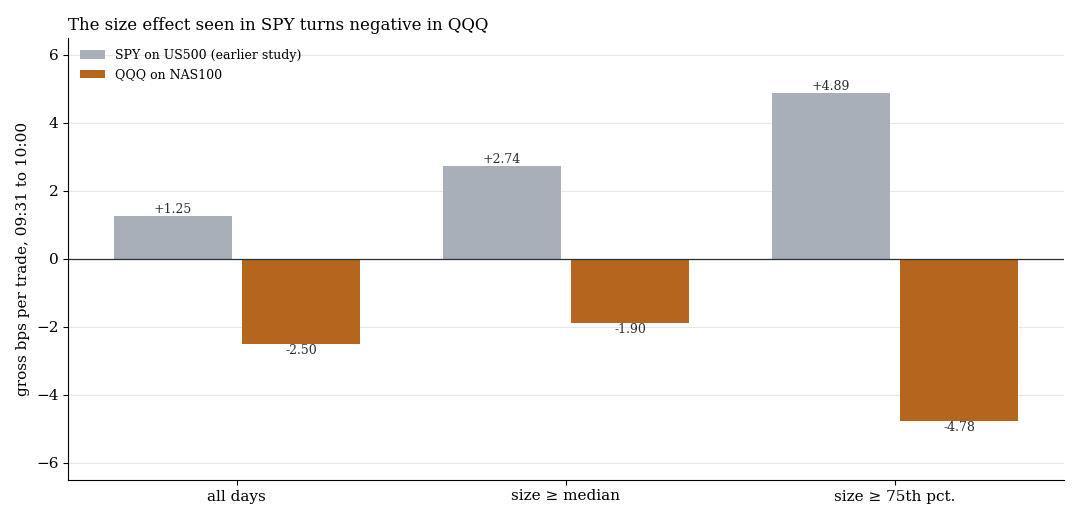
Gross per trade from 09:31 to 10:00 by imbalance size. Grey: SPY on the US500 CFD from the earlier study. Orange: QQQ on the NAS100 CFD. For QQQ it is the large imbalances that lose most.
Every variant is negative even before costs. Always long on the same days made +3.79 bps gross, so the market rose on these days on average and the direction of the imbalance was often wrong. Against randomly swapped directions (mean −1.43 bps) the real direction is worse (p 0.90). On two random markets the same rule loses −6.03 and −7.15 bps.
What it means
The size effect seen in SPY looks like a chance finding in a single market. On the second market it turns into the opposite. That does not mean one should trade against the QQQ imbalance: reversed, the gross values would still be below the costs, and a rule flipped after seeing the result is no longer a pre-registered rule. For the opening auction at ETF level the verdict stands: no edge.
Limits
- CFD instead of auction. The CFD follows the Nasdaq futures, which trade before 09:30.
- Fewer signal days. On many days the QQQ auction reports no imbalance side. At 278 to 566 trades the samples are smaller than for SPY.
- Cost model. Fixed points, a flat 2.5 times that before the open.
- Not tested: single stocks at the open, holding beyond 10:00, the opposite direction as a rule of its own.
All pattern families of the scan in the overview. Related: SPY opening auction, QQQ closing auction via Nasdaq and a strong pre-open hour means a bigger open.
📄 Full study as PDF: 5 pages incl. all tables, figures and limits (in German).
Disclaimer: Historical statistics are no guarantee of future market behaviour. This study is not investment advice. Trading carries a risk of loss up to total loss.