Data basis: DAX and FTSE 100 (Europe), Dow, Nasdaq 100 and S&P 500 (USA), Dukascopy CFD minute data (BID). Search period 2015–2022: 3,924 market days in Europe, 5,870 in the USA. The 2023 to June 2026 holdout, reserved for one final check, was not read. Pre-open hour: DAX and FTSE 08:00–09:00 Berlin, USA 08:30–09:30 New York. Costs only in one cost line. Benchmarks: lowest third, a placebo hour mid-session, two random markets (every minute candle mirrored at its open with probability ½: same volatility, no direction). No trading recommendation.
A common expectation: if the market has run hard in the hour before the cash open (start of the regular session), part of the move is done and less comes at the open. We ask about the size of the move at the open, not its direction.
The push is the close of the last minute before the open minus the open of the first pre-open minute, divided by the ATR, the typical daily range (mean of the daily ranges of the 20 sessions before). It measures the net move, not the range. Strong and weak are the upper and lower third of the absolute push, with thresholds from the 250 days before (no look-ahead). The move after the open is the range of the first 30 and 60 minutes, also in ATR. The definition is that of our earlier study on direction, whose daily values we reproduce exactly (3,924 of 3,936 days, correlation 1.0000). The t-values, clustered by date, count as notable from 2.
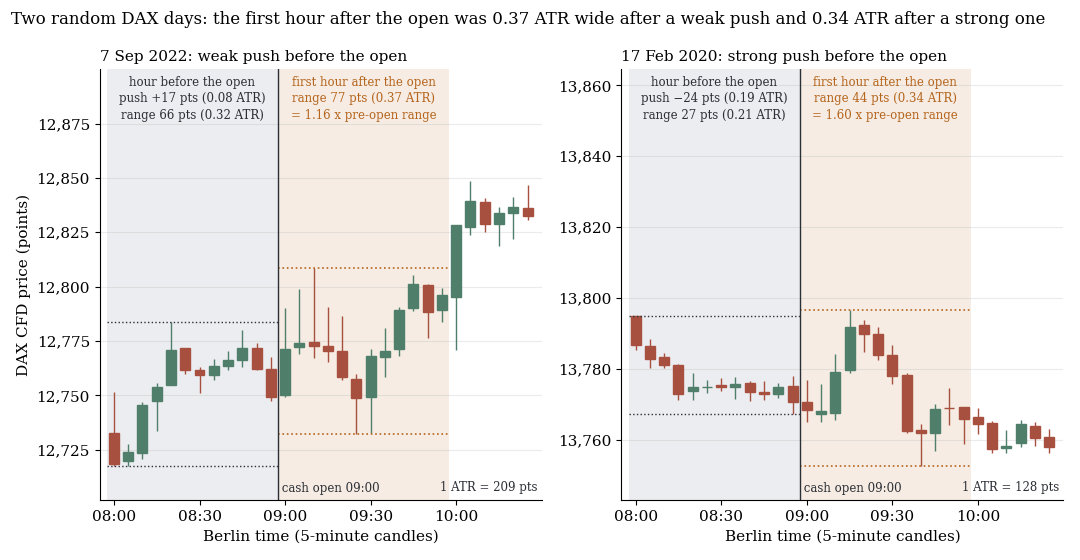
DAX CFD, 5-minute candles. Both days drawn at random with a fixed seed (7), not picked: left from the weak third of pushes, right from the strong third. The effect does not show here (first hour 77 points after the weak push, 44 after the strong one), it is a mean over thousands of days.
1. Bigger, not smaller
After a strong push the first hour after the open is wider, in Europe and in the USA (mean in ATR, 1.0 = typical daily range):
| Push before the open | n (market days) | Pre-open range (median) | first 30 min | first 60 min |
|---|---|---|---|---|
| Europe, weak (lower third) | 1,326 | 0.183 | 0.379 | 0.466 |
| Europe, middle | 1,299 | 0.217 | 0.388 | 0.479 |
| Europe, strong (upper third) | 1,299 | 0.338 | 0.445 | 0.552 |
| USA, weak | 1,957 | 0.152 | 0.387 | 0.497 |
| USA, middle | 1,884 | 0.194 | 0.403 | 0.522 |
| USA, strong | 2,029 | 0.324 | 0.492 | 0.640 |
Strong minus weak, first hour: Europe +0.086 ATR (t 7.6; +19%), USA +0.143 (t 10.8; +29%). For the DAX (median ATR about 158 points) that is roughly 14 points. The US pre-open hour contains the 08:30 New York economic releases. Without high-importance releases (5,325 market days) the difference stays at +0.152 (t 10.3), without any 08:30 release (3,606) at +0.172 (t 8.9).
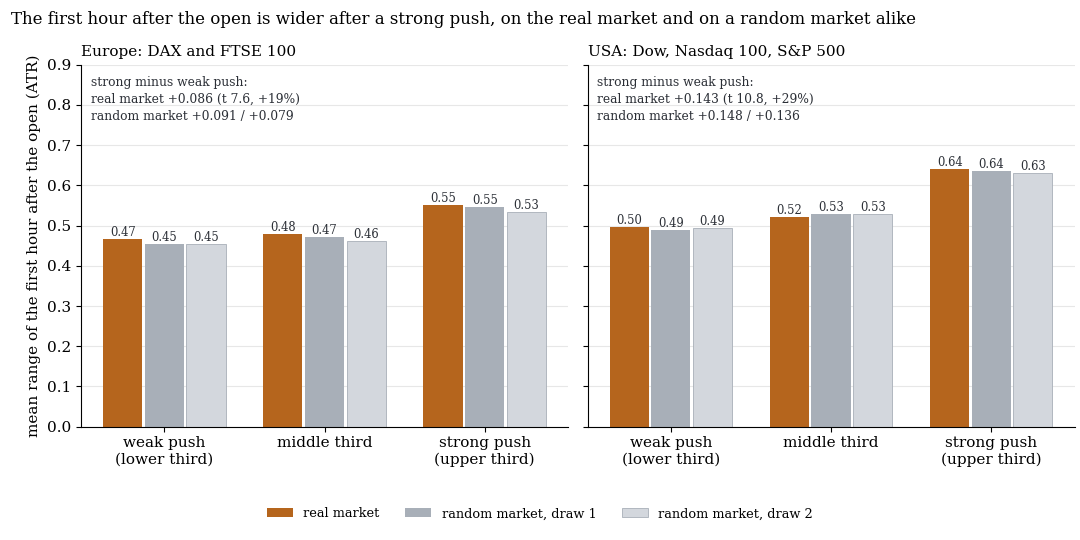
Mean range of the first hour by strength of the push before it, in ATR. Orange: the real market, grey: two random markets.
2. Smaller only in relation, and a random market shows it too
The median ratio of first-hour range to pre-open range falls after a strong push: from 2.37 to 1.40 in Europe, from 2.89 to 1.64 in the USA. A random market without direction shows almost the same:
| Market | first hour, strong minus weak (ATR) | Ratio first hour / pre-open range (median): weak / middle / strong |
|---|---|---|
| Europe, real | +0.086 (+19%) | 2.37 / 2.00 / 1.40 |
| Europe, random market 1 | +0.091 (+20%) | 2.24 / 1.92 / 1.34 |
| Europe, random market 2 | +0.079 (+17%) | 2.21 / 1.91 / 1.36 |
| USA, real | +0.143 (+29%) | 2.89 / 2.38 / 1.64 |
| USA, random market 1 | +0.148 (+30%) | 2.73 / 2.33 / 1.62 |
| USA, random market 2 | +0.136 (+28%) | 2.77 / 2.30 / 1.58 |
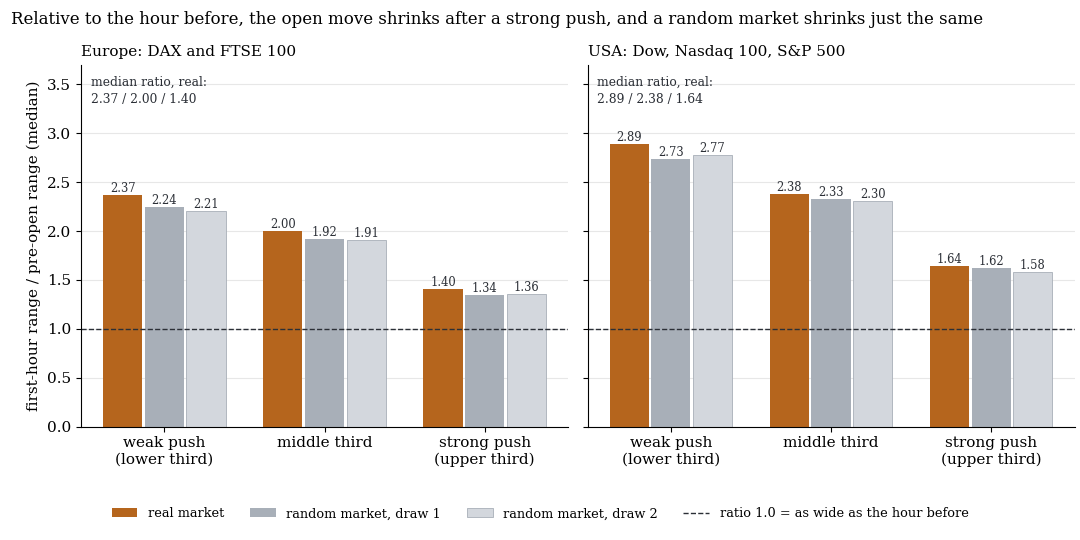
Median first hour divided by pre-open range. The slope is almost the same in all three markets.
Two things can explain the pattern without market behaviour. First, volatility clustering: turbulent phases come in groups, and the random market keeps the candle sizes. Second, regression to the mean: the noisy pre-open range in the denominator contains chance that does not return when it is large. The open is nothing special: mid-session, the hour after a strong-push hour is wider too, even more than at the open (+24%, t 9.8 in Europe; +43%, t 13.6 in the USA).
3. Direction: nothing
In the push direction (plus is follow-through, minus reversal), the move of the 60 minutes after the open cannot be told apart from zero: after a strong push +0.0128 ATR (t 1.05) in Europe, −0.0158 (t −1.11) in the USA, with the random markets in the same range. After the costs of entry and exit (Europe 0.0194, USA 0.0289 ATR), the result is −0.0066 (t −0.54) and −0.0447 (t −3.15).
What it means
The expectation “strong push, then calm” does not hold. After a strong push the first hour is on average 19% (Europe) to 29% (USA) wider, and a random market reproduces both that and the smaller move relative to the pre-open range. The push goes with the width of the first hour (whether it is usable net, we did not test), but gives no direction.
Limits
- Descriptive measurement. No trading simulation, costs only in the cost line, constant spread.
- One look at 2015–2022. The holdout was not read. That two random markets reproduce the figures shows that the pattern comes from the volatility structure. It does not replace a test on later data.
- No multiple-testing correction. Of 24 follow-through t-values (before costs) one exceeds 2 (strongest tenth of the USA without 08:30 releases: −0.1175 ATR, t −2.38, n 257), about one is expected by chance.
- Not tested: other window lengths, weekdays, futures instead of CFDs, follow-up windows beyond 60 minutes, the two explanations separately.
All pattern families of the scan in the overview. Related: volatility regime before the open and VIX curve and VVIX.
📄 Full study as PDF: 7 pages incl. all tables, figures and limits (in German).
Disclaimer: Historical statistics are no guarantee of future market behaviour. This study is not investment advice. Trading carries a risk of loss up to total loss.